Bespoke’s Sector Snapshot — 7/14/16
Jogging of the Bulls
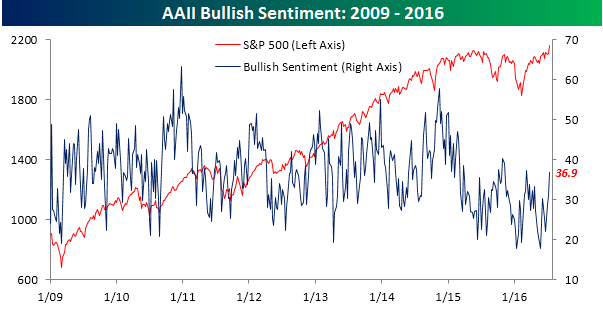
Individual investors have been downright depressed for much of the year, but they’ve shown signs of turning the corner in the last few weeks. According to the weekly sentiment survey from AAII, bullish sentiment increased this week from 31.1% up to 36.9%. It’s the highest weekly reading since early March. What has been most impressive, though, is the gains over the last few weeks. In the last three weeks, for example, bullish sentiment has increased by just under 15 percentage points, which is the largest three-week gain since October 2014. Since the end of May, we have seen an even more impressive improvement with bullish sentiment jumping by over 19 percentage points, making it the largest seven-week increase since November 2011. Given these large increases, surely we must be reaching some frothy levels when it comes to sentiment, right? Wrong. The reality is that at 36.9%, bullish sentiment is still below its bull market average of 39.95% and has been below 40% for 37 straight weeks! Sentiment may be starting to percolate, but the bulls are hardly running yet.
S&P 500 and All Ten Sectors Overbought
Don’t look now, but the S&P 500 and all ten of its major sectors are currently overbought. This means they’re all trading more than one standard deviation above their 50-day moving averages. In the screen below, the light red shading represents between one and two standard deviations above the 50-DMA, while the dark red shading represents between two and three standard deviations above the 50-DMA. As you can see, most sectors are right near the two standard deviation mark. Anything above this level is considered extreme.

S&P 500 Trailing P/E Crosses Above 20
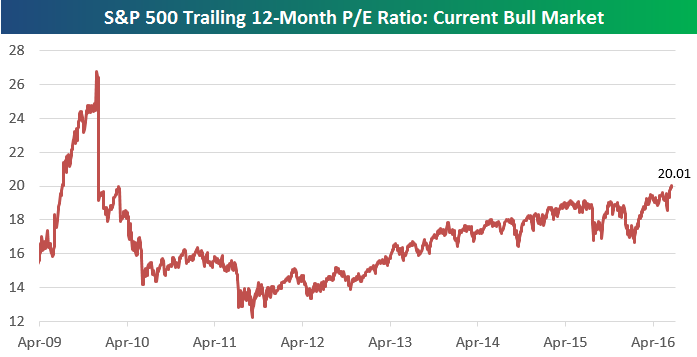
The recent rally to new highs for the S&P 500 has caused the index’s valuation to jump as well. In fact, the S&P’s trailing 12-month P/E ratio has just eclipsed 20 for the first time since the early days of the current bull market. The last time the index’s trailing P/E was above 20 was on December 30th, 2009. Below is a chart showing this valuation reading since April 2009:
Below we extend the time frame back much further to 1990. We also include the S&P’s price in the chart as well.

Bespoke Recent Media Appearances
Bespoke’s Paul Hickey appeared on CNBC’s Fast Money on Wednesday and Bloomberg <GO> to discuss the recent rally in equities, and more specifically, small caps. To view the segments, please click on the images below.


Chart of the Day – Financial Conditions Drive Retail Sales
With June retail sales due out tomorrow from the US Census, we took a look at how our Bespoke Consumer Pulse data does predicting the release. Below we show the close track between MoM retail sales (ex auto and gas) versus our tracker of consumers’ confidence in their finances. As shown, the correlation recently has been very strong, and our June Pulse data is a helpful guide to where retail sales will come in tomorrow. We do not include June data in the chart below.
In today’s Chart of the Day sent to paid subscribers, we update the above chart to show the forecast direction for June retail sales based on our Bespoke Consumer Pulse data. To view it, please start a 14-day free trial below.
the Bespoke 50 — 7/14/16
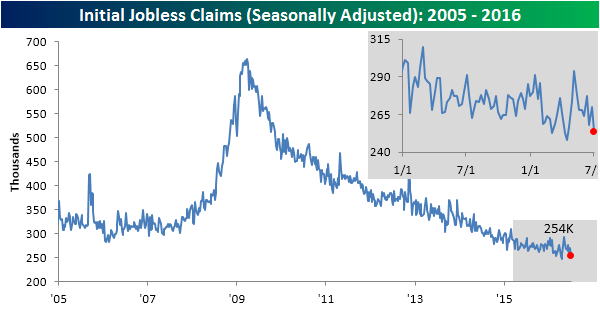
Claims Unchanged Near Historic Lows
Jobless claims for the latest week were precisely unchanged on a seasonally adjusted basis, extending their record run below 300,000 to an astounding 71 weeks. While the pace of improvement for claims (for instance, YoY percent change) has slowed somewhat over the last 12 months, the sideways trend and extreme low levels suggest there’s little imminent threat to the labor market. The low numbers of claims are even more impressive when adjusting for population growth since 1971, when they were last this consistently low.
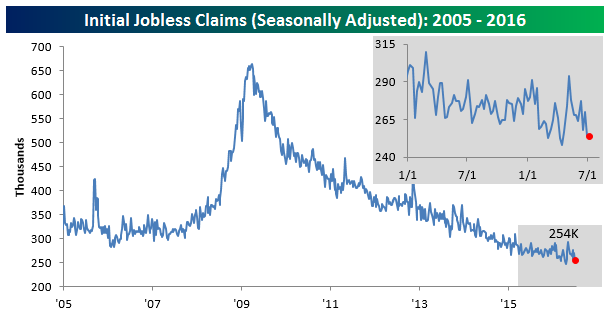
The four-week average of claims ticked back down below 260,000 to 259,000. That’s still slightly above the post-recession low claims count of 256,000 back in April but represents the second-lowest reading since the year 2000. The four-week average has now fallen 7 of the last 8 weeks.

Non-seasonally adjusted (NSA), initial claims were one-third lower than typical for this week of the year since 2000. They’ve averaged 451,000 over the last 15 years, part of a seasonal mid-summer spike. This year, that spike has been much lower than typical, although we could see one more high print before the NSA begins its trend lower in the Fall.
Dynamic Upgrades/Downgrades: 7/14/16
The Closer 7/13/16 – Ages, Wages, Crude In Stages
Looking for deeper insight on global markets and economics? In tonight’s Closer sent to Bespoke clients, we take a look at what changing demographics mean for wages, as well as reviewing today’s DoE/EIA petroleum market data update and the technical setups in energy-related commodities.

The Closer is one of our most popular reports, and you can sign up for a trial below to see it and everything else Bespoke publishes free for the next two weeks!
Click here to start your no-obligation free Bespoke research trial now!