Chart of the Day: Triple Play Breakout
Earnings Beat Rates by Sector
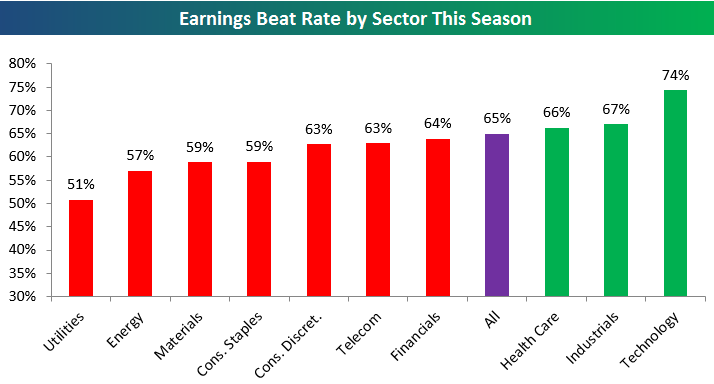
More than 2,000 companies have reported earnings since the Q2 reporting period began on July 11th. Of these 2,000+ reports, 65% posted EPS numbers that were stronger than consensus analyst expectations. That’s a strong reading relative to past earnings seasons over the last five years.
Below is a look at earnings beat rates by sector this season. As shown, the strong overall beat rate of 65% has been driven by Technology, Industrials and Health Care. A whopping 74% of Tech stocks have beaten consensus analyst EPS estimates. Now you know why the sector is on fire lately! The Industrials sector beat rate is at 67%, while it’s 66% for Health Care.
The Utilities sector has the lowest beat rate at 51%. If there’s a sector you want to see in last place for this reading, it’s Utilities! Start a 14-day free research trial to see additional earnings-season analysis.
B.I.G. Tips — Trump vs. Clinton
Clinton Breakout?
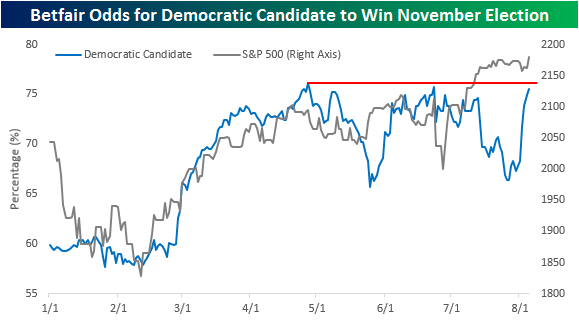
It has no doubt been a rough week for the Presidential prospects of Donald Trump, but in politics, three months is a lifetime, and Trump has made some miraculous recoveries before in his career. That being said, the odds for Clinton to win in November have really rallied in the last several days and are back near their highs of the year at slightly more than 75%. In each of the prior times where Clinton’s odds (late April and late June) have approached current levels, they have quickly pulled back. It is often noted that a strong stock market and a good economy are good for the incumbent party, so with the S&P 500 at new highs and jobs data coming in strong for the second straight month, will this be the leg where Clinton finally breaks out or are her odds due for another pullback? We’ll soon find out!
S&P 500 Weekly Chart Book – 8/5/16
US Credit Rating Downgrade: Five Years Later
It’s a common practice on Wall Street for companies to release bad news on a Friday afternoon, often in the Summer or ahead of a holiday weekend, in the inane belief that maybe no one will notice. Five years ago today (8/5/11), Standard and Poors may have taken a page out of the old Wall Street handbook when it announced late on a Friday evening that it had lowered the AAA sovereign rating of the United States. While the move was widely expected, it was still a shock and sent shivers through the investment community for the rest of that August and September. While the short-term implications of S&P’s downgrade sent stocks sharply lower and bonds surprisingly higher, the long run picture has been much different than most would have probably expected when they contemplated the move over that August weekend.
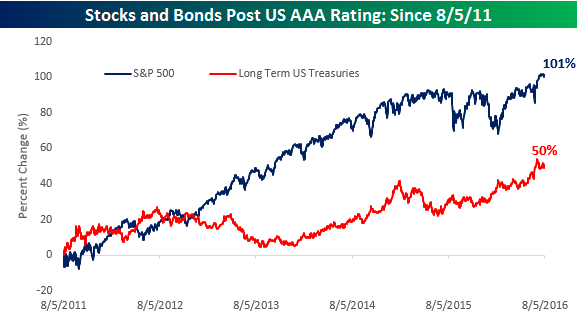
The chart below shows the total return of the S&P 500 and long-term US treasuries over the last five years starting from the close on 8/5/11. While the S&P 500 initially declined 8% on a total return basis, the index has more than doubled since 8/5/11 with a gain of 101%. That’s an annualized return of 15%! Treasuries initially rallied on the news of the downgrade as investors flooded into safe assets and were up over 10% within six weeks of the rating downgrade, but since then the pace of gains has stalled. In total, long-term treasuries have returned 50% since the downgrade. That works out to an annualized return of roughly 8.5%. Not too bad either, but half that of equities.
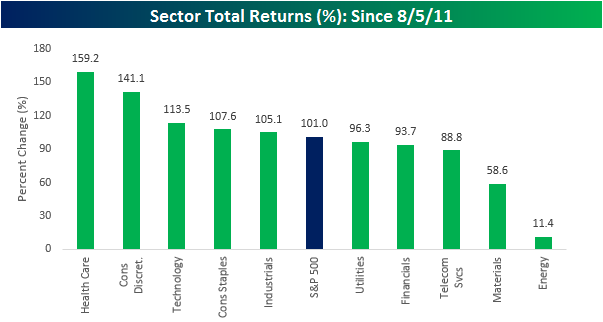
While stocks have done well over the last five years, sector performance has varied widely. While every sector is up during this period, the performance spread between the best and worst performing sectors is nearly 150 percentage points! On the upside, Health Care, fueled by biotechs, has put up a total return of 159.2%. Behind Health Care, Consumer Discretionary (141.1%), Technology (113.5%), Consumer Staples (107.6%), and Industrials (105.1%) have all outperformed the S&P 500. On the downside, Energy has been the worst performing sector over the last five years with a total return of just 11.4%. Besides Energy, the only other sector that has significantly underperformed the S&P 500 is Materials (+58.6%).
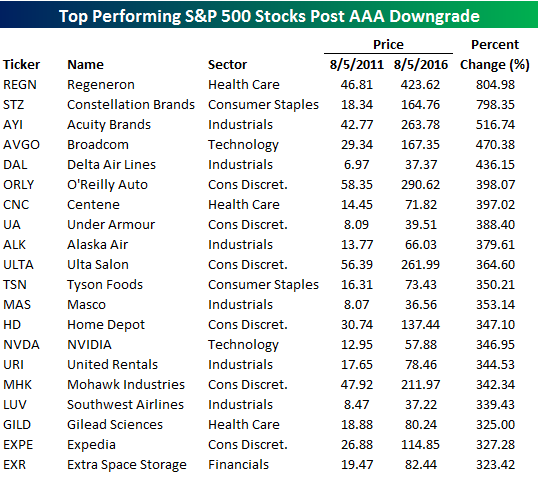
On an individual stock basis, the tables below list the best and worst performing current S&P 500 stocks since 8/5/11. First the winners. With a gain of over 804%, Regeneron (REGN) has been the top performing stock in the index, rising from $46 up to $423. While a stock from the Health Care sector tops the list, only three of the biggest winners are from that sector even though it has been the best performing sector overall. The sectors with the most representation on the list are Consumer Discretionary and Industrials, with six each.
On the downside, it shouldn’t come as much of a surprise that a lot of stocks from the Energy sector made the list. As shown, more than half of the 20 names listed below are from the Energy sector. Leading the way lower, shares of Chesapeake (CHK) have lost over 80% of their value. Likewise, it has been a horrible five years for Transocean (RIG) as well, as that stock is down over 80%. Outside of the Energy sector, some of the standout names on the list of losers include First Solar (FSLR), which you could consider an Energy company, NetApp (NTAP), and Staples (SPLS).

The Closer 8/4/16 – Oil Machinery
Looking for deeper insight on global markets and economics? In tonight’s Closer sent to Bespoke clients, we summarize today’s Final Manufacturers’ Sales, Inventories, and New Orders report. We also forecast 2015 and 2016 oil equipment spending ahead of the pending release of 2015 private fixed asset investment figures.

The Closer is one of our most popular reports, and you can sign up for a trial below to see it and everything else Bespoke publishes free for the next two weeks!
Click here to start your no-obligation free Bespoke research trial now!
Bespoke’s Sector Snapshot: 8/4/16
We’ve just released our weekly Sector Snapshot report (see a sample here) for Bespoke Premium and Bespoke Institutional members. Please log-in here to view the report if you’re already a member. If you’re not yet a subscriber and would like to see the report, please start a 14-day trial to Bespoke Premium now.
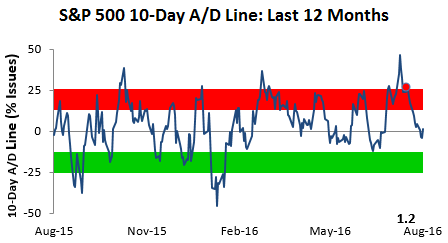
Below is one of the many charts included in this week’s Sector Snapshot, which shows the 10-day advance/decline line for the S&P 500. This reading measures the average number of daily advancers minus decliners over a rolling 10-trading day period, and it’s an important breadth indicator to follow. When this reading hits extremes in either direction, it’s usually a sign that a turning point is near. As shown, at the moment, the S&P’s 10-day advance/decline line is as neutral as it gets. This means the market has plenty of room to run in either direction before getting too extended (to either the upside or downside) again.
To see our full Sector Snapshot with additional commentary plus six pages of charts that include analysis of valuations, breadth, technicals, and relative strength, start a 14-day free trial to our Bespoke Premium package now. Here’s a breakdown of the products you’ll receive.
ETF Trends: International – 8/4/16
Below is our daily list of the twenty best and twenty worst performing ETFs over the last five trading days. After slipping slightly yesterday, gold rallied, and the top two spots were held by Junior Gold Miners and Gold Miners. The oil exposures also were up again as oil stayed above $40 a barrel. A number of Asian exposures struggled including Vietnam and Hong Kong. Brazil, Emerging Latin America, and Latin America all turned in strong performances. Construction and homebuilding exposures continued to perform poorly.

Bespoke provides Bespoke Premium and Bespoke Institutional members with a daily ETF Trends report that highlights proprietary trend and timing scores for more than 200 widely followed ETFs across all asset classes. If you’re an ETF investor, this daily report is perfect. Sign up below to access today’s ETF Trends report.
See Bespoke’s full daily ETF Trends report by starting a no-obligation free trial to our premium research. Click here to sign up with just your name and email address.
Chart of the Day: The Olympic Indicator
With the opening ceremony of the Rio Olympics starting this Friday, we went back and calculated the performance of the S&P 500 during each Summer Games since 1928. The reason for using the cut-off of 1928 was due to the fact that Olympic Games prior to 1928 tended to take place over the course of months rather than the current two weeks. We also found the performance of the market for host countries during the Summer Olympics since 1984. Prior to 1984, data for foreign indices is sporadic.
To see the analysis presented in today’s Chart of the Day start a 14-day free trial to Bespoke’s paid research below.