Chart of the Day: Global Banks Breaking Out
the Bespoke 50 — 9/1/16
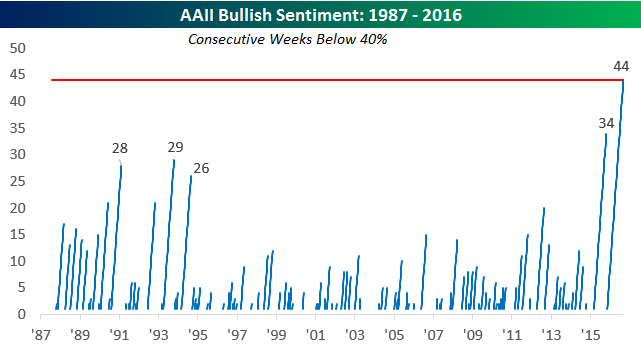
Bullish Sentiment Below 40% for 44th Straight Week
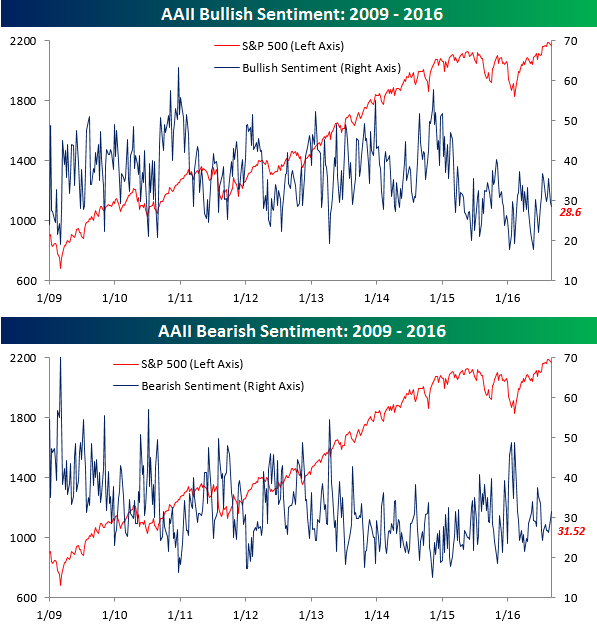
Below is an updated look at the weekly AAII (American Association of Individual Investors) bullish and bearish sentiment readings. These readings measure US stock market sentiment from individual investors. This week, AAII Bullish Sentiment came in at 28.6%, down 0.82 points from last week’s reading of 29.42%. At the same time, AAII Bearish Sentiment jumped to 31.52%, up 1.88 points from last week’s reading of 29.64%. Neither reading had an extreme move, and neither is at the top or bottom end of its two-year range. Nonetheless, sentiment towards stocks from individual investors right now is far from optimistic.
It’s also worth pointing out that this was the 44th consecutive week that AAII Bullish Sentiment was below 40%. As shown below, this is the longest streak of sub-40% weekly readings since 1987. Hard to believe given the rally to new all-time highs we’ve seen over the last few months.
Initial Jobless Claims Better Than Expected
Weekly Initial Jobless Claims came in lower (better) than expected this morning, with the seasonally adjusted print coming in at 263,000 versus a consensus economist estimate of 265,000. This is the sixth straight week of readings in the 260s, and it’s the 78th consecutive week below 300k. The 78-week streak of sub-300k readings is the longest since 1970. Below is a look at a long-term chart of seasonally-adjusted Initial Jobless Claims going back to 2005. The string of weekly readings in the mid-200,000s over the last year and a half has been pretty amazing.
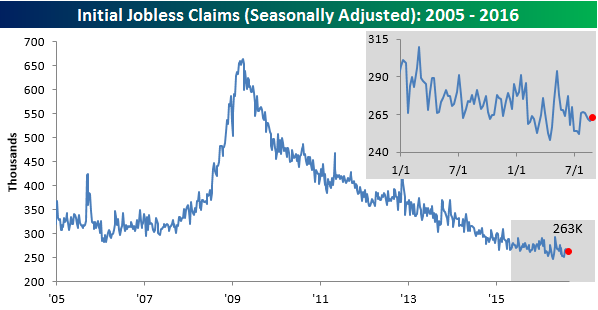
Below is a chart of the four-week moving average of seasonally-adjusted Initial Jobless Claims going back to 2005. This week’s reading is 263,000 — not enough to make a new low, but a healthy print nonetheless.

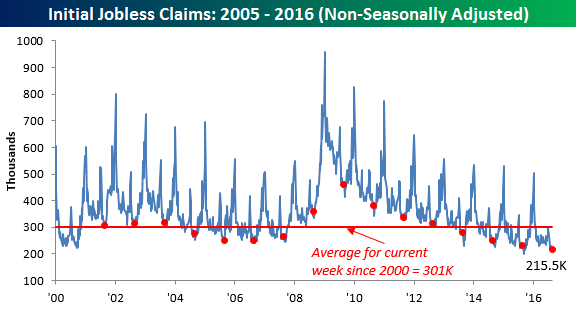
Non-seasonally adjusted Initial Jobless Claims came in at 215,500. The average non-seasonally adjusted reading for this week of the year since 2000 has been 301,000, so this week’s reading is well below average. It’s also the lowest print for this week of the year since at least 2000.
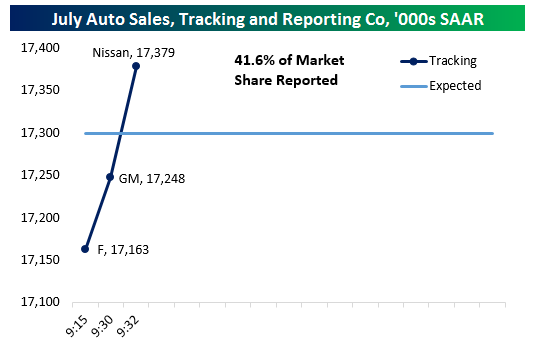
Auto Sales Tracker Off To A Rocky Start After Ford & GM Report
We’re tracking auto sales releases throughout the day as they come in again this month. August sales are expected to come in at 17.2mm SAAR, versus a surprise beat of 17.77mm SAAR last month. Throughout the day, we’ll be processing non-seasonally adjusted reports from each company into a tracker of what the final, seasonally-adjusted number should look like. Thus far, the biggest two US auto makers (Ford and GM) have reported very disappointing numbers. It’s worth pointing out that the same rocky start happened last month, with sales tracking a miss after the first two reported. Strong numbers from foreign OEMs helped push up the total tracker later in the day, but the early reports for August have placed our tracker in a much deeper hole early. Stay tuned for updates throughout the trading day. We’ll be updating the chart below as each automaker releases their figures.
Update 1 9:52 AM: Fiat-Chrysler (+3% YoY) and Nissan (-6.5% YoY) have both reported sales and the results are broadly in-line with Ford and GM. With a bit over half of US market share reported, sales look set to come in below the 17mm SAAR level, even if there are relatively strong reports from other US auto market players later in the day.
Update 2 10:37 AM: Sales reports from Audi (+2.5% YoY), Honda (-3.8%), and Mazda (-12.8%) have crossed the tape, with relatively little impact on our tracker for SAAR rate in the month of August. So far, of the reported OEMs, only Audi has managed to post a truly solid month of sales, with either declines or misses from the rest of the pack. With about two-thirds of market share reported, the odds of a beat on auto sales in the month of August look very low indeed.
Update 3 11:03 AM: Volkswagen (-9.1% YoY) and Toyota (-5% YoY) have now reported August sales and that brings the total reported share of the market up to 82%. As shown, our tracker is still sitting around 16.8mm SAAR, well below estimates of 17.2mm SAAR. If the current level around 16.81mm SAAR is the number for August, it will be the third-worst report of the year and mark the 9th month in a row auto sales were unable to make a new high. Hyundai, Subaru, and Kia are the last major manufacturers to report, collectively about 12% of market share; all three outperformed in July in terms of total unit sales, but it’s a big ask for them to push the needle much higher given the weak reports from far larger OEMs so far today.
Update 4 14:53 PM: While most of the auto market suffered badly in August, Subaru delivered 14.7% YoY sales gains and pushed our tracker back up towards 16.9mm SAAR from the 16.76mm SAAR tracking after disappointing reports from Mercedes, BMW, and KIA. This will be our final update until Wards and Auto Trader release their summary estimates later tonight. With almost 94% of market share reported, we expect SAAR of 16.88mm to be announced for August auto sales.
The Closer 8/31/16 – Demographic Comfort
Looking for deeper insight on global markets and economics? In tonight’s Closer sent to Bespoke clients, break down weekly oil inventory data from the EIA and discuss the demographics of consumers’ feelings on the economy.

The Closer is one of our most popular reports, and you can sign up for a trial below to see it and everything else Bespoke publishes free for the next two weeks!
Click here to start your no-obligation free Bespoke research trial now!
August 2016 Asset Class Performance
Below is our asset class performance matrix for August now that the month is over. The left side of the matrix contains mostly US equity ETFs, while the right side contains international equity ETFs, commodity ETFs, and fixed income ETFs. For each ETF, we show its performance in August, quarter to date, and year to date.
The S&P 500-tracking SPY ETF ended up 12 basis points in August. The first half of the month saw gains that ended up getting erased in the second half. The Dow 30 ETF (DIA) ended up down 10 basis points, while the Nasdaq 100 ETF (QQQ) gained 1.05%. Quarter-to-date, QQQ is up 8.28%, which is one of the top performers in the entire matrix.
Small-caps outperformed large-caps and mid-caps in August, while growth outperformed value. Dividend stocks underperformed. Looking at US sectors, the Financial ETF (XLF) gained by far the most in August at +3.85%. The Energy ETF (XLE) was up the second-most at +1.68%. Telecom (IYZ) and Utilities (XLU) — high dividend paying sectors — both fell more than 5%. These two sectors are down the most quarter-to-date as well, but they’re still up more than 10% YTD.
Outside of the US, Australia (EWA) fell the most in August, while China (ASHR) rallied 3.54%. Brazil (EWZ) ended the month with only a small gain of 0.84%, but it’s up by far the most YTD at +62.09%. Italy (EWI) remains down the most YTD at -17.83%.
Oil (USO) was up 6.15% in August even after falling sharply at month end. Silver (SLV) was down more than any other ETF in August with a decline of 8.42%. Treasury ETFs fell in August as well but are still up year-to-date across the board.
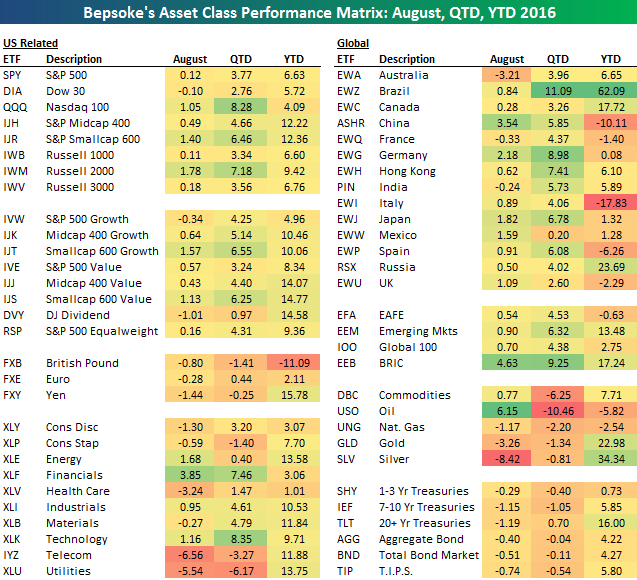
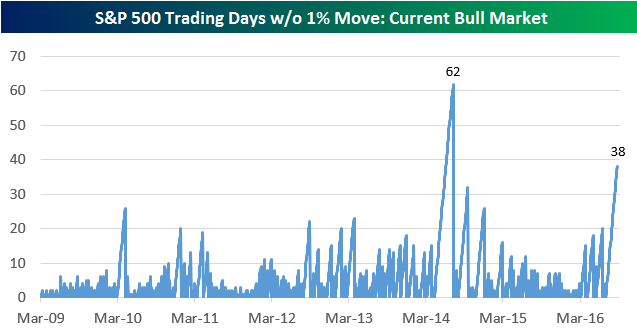
Chart of the Day: 38 Trading Days Without a 1% Move…Will the Next One Be Up or Down?
The S&P 500 has now gone 38 trading days without a 1%+ move in either direction (that’s including today). Since WW2, there have only been 34 prior streaks of 38 trading days or more without a 1%+ absolute move. There have only been 7 (including the current one) since 1979, and as shown in the chart below, there have only been two during the current bull market. Of the 34 prior streaks that went 38 trading days or longer, the median streak ended after 57 trading days.
In today’s Chart of the Day, which was sent to paid subscribers, we look at the 34 prior streaks of 38+ trading days to see which direction the S&P typically breaks when the 1%+ move finally occurs. The results will likely surprise you. See today’s Chart of the Day by starting a 14-day free trial to Bespoke’s premium research below.
Fixed Income Weekly – 8/31/16
Searching for ways to better understand the fixed income space or looking for actionable ideals in this asset class? Bespoke’s Fixed Income Weekly provides an update on rates and credit every Wednesday. We start off with a fresh piece of analysis driven by what’s in the headlines or driving the market in a given week. We then provide charts of how US Treasury futures and rates are trading, before moving on to a summary of recent fixed income ETF performance, short-term interest rates including money market funds, and a trade idea. We summarize changes and recent developments for a variety of yield curves (UST, bund, Eurodollar, US breakeven inflation and Bespoke’s Global Yield Curve) before finishing with a review of recent UST yield curve changes, spread changes for major credit products and international bonds, and 1 year return profiles for a cross section of the fixed income world.
This week, we discuss the ratio of stock volatility to bond volatility and what that means for relative performance between the two going forward. We also discuss the flattening of the short-term interest rate term structure in the Eurodollar markets and the general decline in yields across fixed income.
Our Fixed Income Weekly helps investors stay on top of fixed income markets and gain new perspective on the developments in interest rates. You can sign up for a Bespoke research trial below to see this week’s report and everything else Bespoke publishes free for the next two weeks!
Click here to start your no-obligation free Bespoke research trial now!
ETF Trends: US Sectors & Groups – 8/31/16
Banks have been the best performers in the US equity markets over the past few days but its Japanese equities (hedged for the fall in yen) that have been the top gainer over the last five days among ETFs we track. We also note European FX-hedged equities have done very well, along with a few odds and ends. Gold continues to underperform on the losing side of the equation while WTI is making fresh lows today following a larger than expected inventory build reported by the EIA.

Bespoke provides Bespoke Premium and Bespoke Institutional members with a daily ETF Trends report that highlights proprietary trend and timing scores for more than 200 widely followed ETFs across all asset classes. If you’re an ETF investor, this daily report is perfect. Sign up below to access today’s ETF Trends report.
See Bespoke’s full daily ETF Trends report by starting a no-obligation free trial to our premium research. Click here to sign up with just your name and email address.