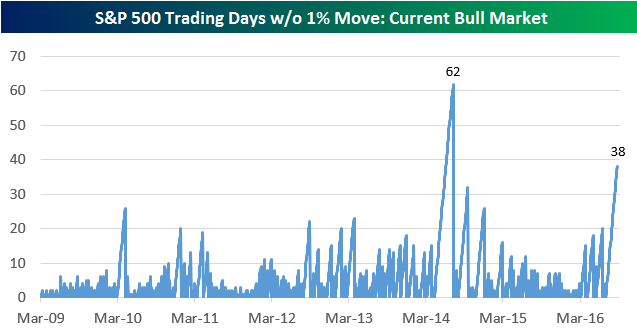
The S&P 500 has now gone 38 trading days without a 1%+ move in either direction (that’s including today). Since WW2, there have only been 34 prior streaks of 38 trading days or more without a 1%+ absolute move. There have only been 7 (including the current one) since 1979, and as shown in the chart below, there have only been two during the current bull market. Of the 34 prior streaks that went 38 trading days or longer, the median streak ended after 57 trading days.
In today’s Chart of the Day, which was sent to paid subscribers, we look at the 34 prior streaks of 38+ trading days to see which direction the S&P typically breaks when the 1%+ move finally occurs. The results will likely surprise you. See today’s Chart of the Day by starting a 14-day free trial to Bespoke’s premium research below.
