The Closer 9/27/16 – Pick ‘EM, Consumers Crush
Looking for deeper insight on global markets and economics? In tonight’s Closer sent to Bespoke clients, we introduce screens for stocks with elevated volatility levels as a way to identify candidates for options selling strategies. We also discuss strong new home sales and today’s Dallas Fed Manufacturing Index release.

The Closer is one of our most popular reports, and you can sign up for a trial below to see it and everything else Bespoke publishes free for the next two weeks!
Click here to start your no-obligation free Bespoke research trial now!
Trump vs. Clinton — One Word to Describe Each Candidate
Each month, Bespoke runs a survey of 1,500 U.S. consumers balanced to census for their views on the broad economy as well as their personal finances. (Please see bottom of post for more details on our survey work.) Since our May 2016 survey, we’ve been asking participants in each month’s survey to fill in one word to describe each of the current US Presidential candidates. In early June, we published our first word cloud of the survey responses, which you can view here. Below are new word clouds using this month’s responses. Remember, the bigger the word, the more it was used.
In this month’s survey that was just recently completed, the results look pretty much the exact same as they did back in June. The majority of Americans view both candidates in a negative light, and in most cases extremely negative. The most used word to describe Trump was “idiot.” Of the 1,398 survey takers that answered the question, 66 described Trump as an “idiot.” The next most-used word to describe Trump was “a**hole” at 53, followed by “racist” at 50 and then “arrogant” at 45. “Crazy” and “stupid” were both used by 32 people. If you’re looking for positives, “honest” was the 8th most used word behind idiot, a**hole, racist, arrogant, crazy, stupid, and ignorant.

That was Trump…now on to Clinton. The results aren’t much better. Of the 1,411 responses, 218 survey-takers best described Clinton as a “liar.” That’s 15%, and far above the top word for Trump (idiot) which was 4%. Not only that, but the next most used word to best describe Clinton was “untrustworthy” at 66 (4.7%), and the fourth most used word was “dishonest” at 39 (2.7%). The silver lining for Clinton is that the third most used word to describe her was a positive one in “experienced.” A total of 41 survey takers typed in “experienced” as the one word to best describe Clinton.
Overall, voters have extremely negative opinions of the two candidates — one of which will be the next President. Clinton is seen as a liar and Trump is seen as a crazy, arrogant, racist idiot.

If you’d like to see the rest of our data and analysis from our monthly consumer survey, please read on below:
Along with our unique and thought-provoking stock market coverage, Bespoke has another research offering geared towards investors looking to stay ahead of economic and consumer-related trends. Each month, Bespoke surveys thousands of consumers balanced to census to get basically a real-time look at every aspect of the economy. We then package the survey results into our extremely insightful Consumer Pulse Report, which is available as part of our Pulse subscription offering. Below is a snapshot of page one of this month’s Pulse report that was just sent to Pulse subscribers. This is our interactive dashboard that subscribers use to browse through the report. As you can see, the breadth of coverage in the report is remarkable. If you’d like to read it, you can do so for free by signing up for a 30-day trial to our monthly or annual Pulse package below. Also included with a subscription is access to two Pulse Model Portfolios and additional content released throughout the month!
Annual — Bespoke Consumer Pulse — $365/Year w/ 1-Month Free Trial
Monthly — Bespoke Consumer Pulse — $39.99/Month w/ 1-Month Free Trial
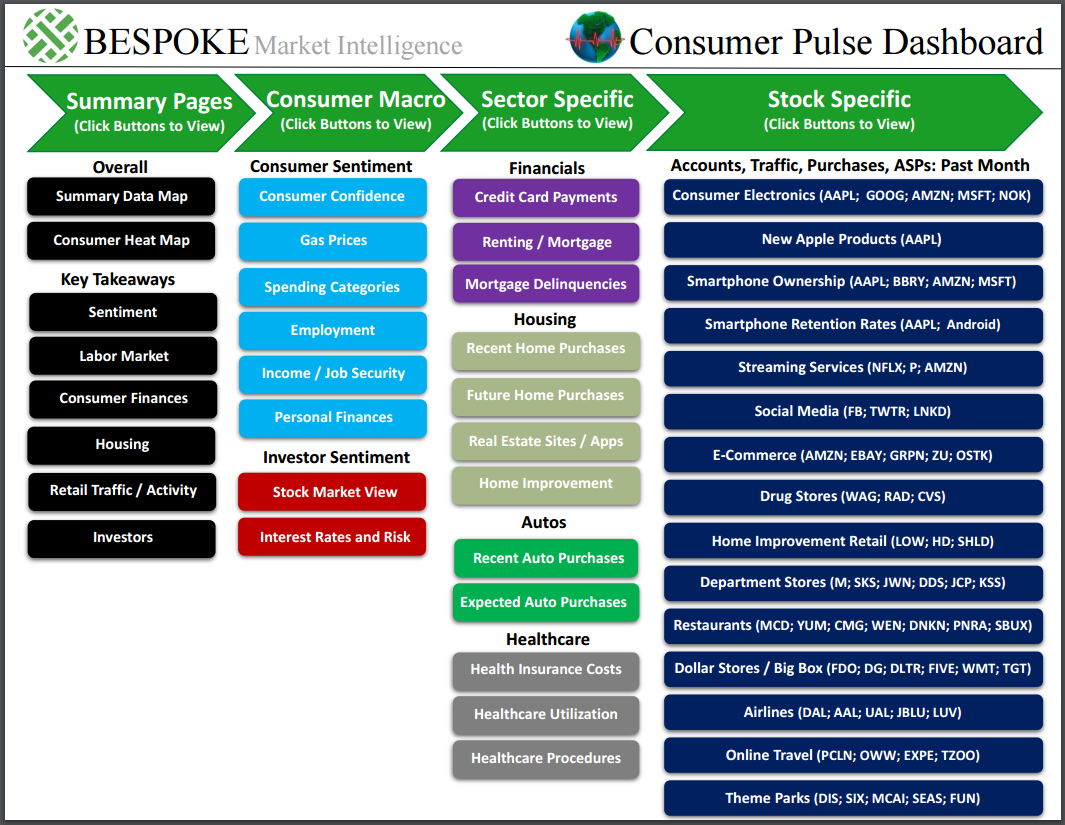
Chart of the Day – Debate Aftermath
Cintas (CTAS) Earnings History
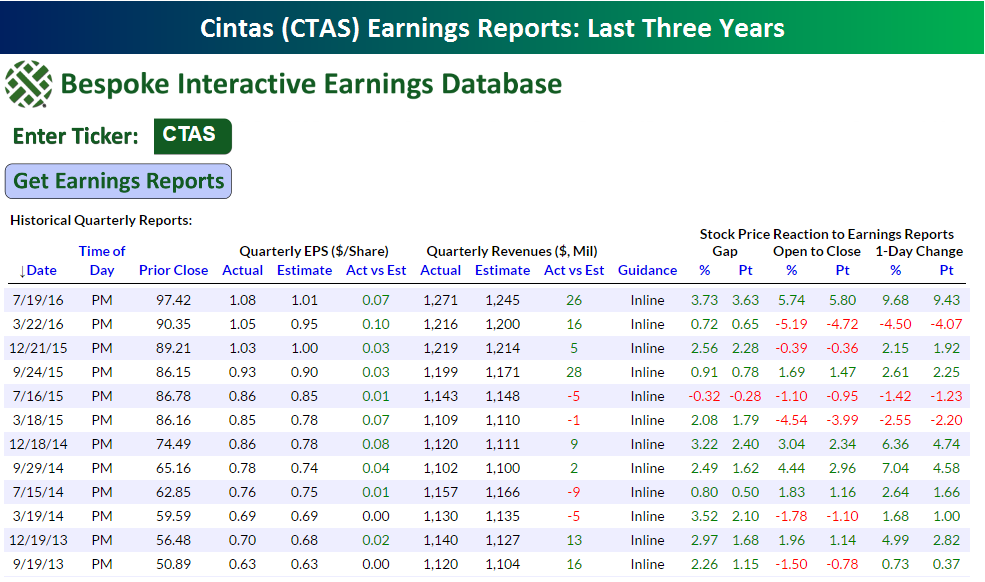
Our Interactive Earnings Report Database is an extremely useful tool for all Bespoke Institutional clients. The database allows users to view historical quarterly earnings reports for nearly all U.S. stocks going back to the turn of the century (2001), and you can sample it right now by signing up for a 14-day free trial to a monthly or annual membership. Below is sample look at the earnings information you’ll see when you search for an individual stock on our site. In this instance, we highlight quarterly reports for Cintas (CTAS) going back three years, but as mentioned, the actual online database contains all reports going back to 2001.
CTAS reports earnings after the close today (Tuesday) and is expected to earn $1.08 per share on revenues of 1.27 billion. As shown in the table, though, CTAS has made a habit of beating EPS forecasts (nine straight better than expected reports), while revenues have tended to come in roughly inline to ahead of forecasts. Its biggest revenue miss was $9 million, while the biggest top-line beat was $28 million last September. So, how has the stock initially responded to these reports? As shown in the table, shares of CTAS have gapped up at the open following 11 of its last 12 earnings reports for an average positive gap of just over 2%.
ETF Trends: US Indices & Styles – 9/27/16
Mexico has legged higher over the past week, with the huge rally in the peso overnight following yesterday’s Presidential debate a significant driver of outperformance. Metal and steel stocks continue to outperform along with emerging markets and the long end of the yield curve. Lower rates have also pulled up prices for REITs. On the other side of the ledger, the Philippines and Natural Gas have reversed recent gains while financials have underperformed on the flattening of the yield curve.

Bespoke provides Bespoke Premium and Bespoke Institutional members with a daily ETF Trends report that highlights proprietary trend and timing scores for more than 200 widely followed ETFs across all asset classes. If you’re an ETF investor, this daily report is perfect. Sign up below to access today’s ETF Trends report.
See Bespoke’s full daily ETF Trends report by starting a no-obligation free trial to our premium research. Click here to sign up with just your name and email address.
Bespoke Stock Scores: 9/27/16
Confidence Among Low Income Consumers Surges
Consumer Confidence for the month of September was released earlier today and showed a surprisingly large increase. While economists were expecting the headline number to come in at a level of 99.0, the actual reading came in at a level of 104.1 from an upwardly revised level of 101.8 last month. With this month’s reading, Consumer Confidence is now at its highest level of the entire recovery and well above the long-term average of 93.4.

Within the overall report, each month we also track confidence levels based on income. Throughout this recovery, we have highlighted the widening gap in confidence between consumers with incomes above $50K versus those with incomes between $35K and $50K. In recent months, this gap has narrowed as consumers in the ‘middle’ income cohort have seen a spike in confidence levels. What was interesting about this month’s report is that even as overall confidence increased, both of these income groups saw a decline in confidence.

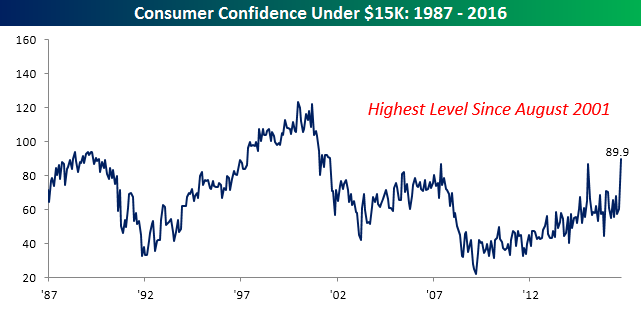
What was interesting about the confidence data by income was where we saw the biggest spike; that was in the cohort of those with incomes below $15K. In this month’s report, overall confidence for those with sub-$15K incomes spiked from 60.3 up to 89.9. That’s the highest monthly reading since August 2001 and the largest monthly increase on record going back to 1980.
Last Week of Quarter Starting off According to Script
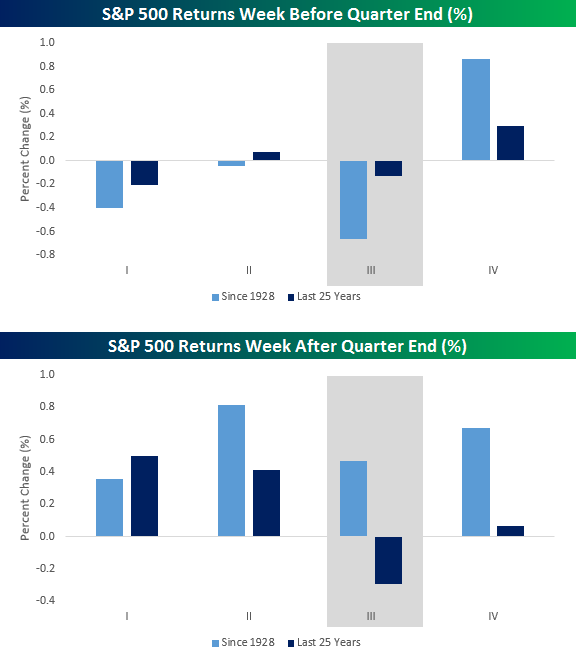
 With Monday’s decline in stocks, the equity market kicked off the last week of Q3 right according to the script. The table to the right and the charts below show the average historical performance of the S&P 500 during the last week of each quarter and the first week of the following quarter going back to 1928 and over just the last 25 years. The last week of the quarter has historically been weak for the first three-quarters of the year but especially weak for Q3. Since 1928, the S&P 500 has averaged a decline of 0.66% during the last week of Q3. In the last 25 years, the returns have not been quite as bad, but they are still negative (-0.13%). We would also note that the last week of Q3 has been negative in seven of the last eight years, so even during the current bull market returns have been weak during this period. The quarter that finishes off on the most positive note is Q4. Going back to 1928, the S&P 500 has averaged a gain of 0.86%, and over just the last 25 years it has averaged a gain of 0.30%.
If there is a silver lining to the typical weakness we see at the end of Q3, it is that the first week of Q4 typically sees a rebound. As shown on the right-hand side of the table and the second chart below, the S&P 500 has averaged a gain of 0.47% during the first week of Q4. Over the last 25 years, the return has been negative (-0.29%), but that decline is wildly skewed by the 14.59% drubbing we saw in the first week of Q4 2008. Since the bull market began in 2009, the S&P 500 has seen gains during the first week of Q4 five out of seven times for an average gain of 0.97%.
The Closer 9/26/16 – Volatility Screen, Dallas Fed, New Home Sales
Looking for deeper insight on global markets and economics? In tonight’s Closer sent to Bespoke clients, we introduce screens for stocks with elevated volatility levels as a way to identify candidates for options selling strategies. We also discuss strong new home sales and today’s Dallas Fed Manufacturing Index release.
The Closer is one of our most popular reports, and you can sign up for a trial below to see it and everything else Bespoke publishes free for the next two weeks!
Click here to start your no-obligation free Bespoke research trial now!