Fixed Income Weekly – 1/11/17
Searching for ways to better understand the fixed income space or looking for actionable ideals in this asset class? Bespoke’s Fixed Income Weekly provides an update on rates and credit every Wednesday. We start off with a fresh piece of analysis driven by what’s in the headlines or driving the market in a given week. We then provide charts of how US Treasury futures and rates are trading, before moving on to a summary of recent fixed income ETF performance, short-term interest rates including money market funds, and a trade idea. We summarize changes and recent developments for a variety of yield curves (UST, bund, Eurodollar, US breakeven inflation and Bespoke’s Global Yield Curve) before finishing with a review of recent UST yield curve changes, spread changes for major credit products and international bonds, and 1 year return profiles for a cross section of the fixed income world.
In this week’s note, we investigate Treasury positioning and what it likely means for the path of interest rates.

Our Fixed Income Weekly helps investors stay on top of fixed income markets and gain new perspective on the developments in interest rates. You can sign up for a Bespoke research trial below to see this week’s report and everything else Bespoke publishes free for the next two weeks!
Click here to start your no-obligation free Bespoke research trial now!
Best Performing Stocks Since the iPhone Debut
Get Bespoke’s 2017 Outlook Report with a 30-day free trial to Bespoke’s premium research! Click here to learn more.
Nostalgia was in the air this past Monday since it marked the 10-year anniversary of the iPhone‘s introduction. If you’d like to re-visit that day when Steve Jobs took the stage in Cupertino, you can view it in full here. A lot has happened since January 2007. At that point, President Obama was just a Senator, and the Financial Crisis that would define a generation had begun under the surface but not yet reared its head. It wasn’t until October of 2007 that global equity markets would peak and begin what would be a 50% drop over the next 18 months.
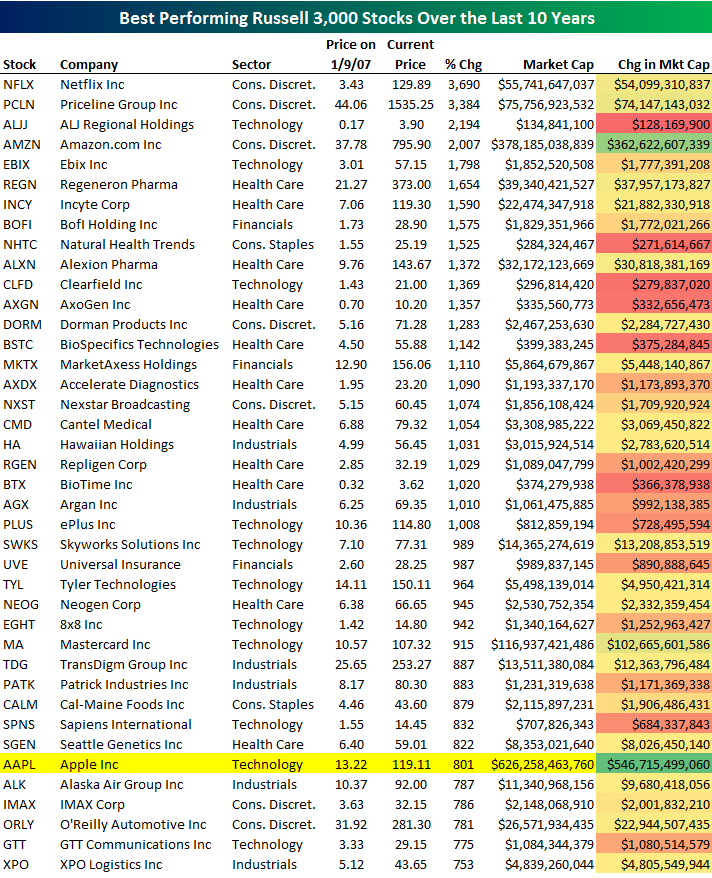
To mark the 10-year anniversary of the iPhone’s introduction, below is a look at the 40 best performing stocks in the Russell 3,000 (current members) since January 9th, 2007. Before getting to the list, we wanted to point out that of the 3,000 or so stocks currently in the Russell 3,000, a third of them weren’t even in existence ten years ago! That fact shows just how much things change over what is seemingly a short period of time.
For the roughly 2,000 stocks in the Russell 3,000 that were around ten years ago, their median change over this time period has been just 53.7%. Just under 700 stocks in the index (23%) are up more than 100% over the last ten years, while 90 (3%) are up more than 500%. There have been a total of 23 “ten-baggers,” or stocks that have gained more than 1,000%.
As shown below, Netflix (NFLX) has been the biggest winner over the last ten years with a gain of 3,690%. On a split-adjusted basis, NFLX was trading at $3.43/share on 1/9/07, and it’s at $129.89 today. The company had a market cap of roughly $1.6 billion back then, which is up to $55.7 billion today. Priceline (PCLN) also had a market cap of roughly $1.6 billion back in January 2007, and its market cap is up to $75.8 billion today. PCLN’s stock price has risen from $44.06 up to $1,525 — a gain of 3,384%. NFLX and PCLN are the only two index members to gain more than 3,000% over the last ten years.
The other major stock that ranks in the top five is Amazon.com (AMZN). AMZN has been the fourth biggest gainer in the Russell 3,000 over the last ten years, and it has seen the second biggest jump in market cap. In percentage terms, AMZN’s stock price has gained 2,007%, and its market cap has risen $362.6 billion from roughly $15 billion up to $378.2 billion.
Given that we’re conducting this exercise because of the 10-year anniversary of the iPhone, you’re probably wondering how Apple’s (AAPL) stock price has performed over this time period. While Apple doesn’t rank in the top five, it does show up on our list at #35 with a gain of 801%. In terms of market cap gains, Apple claims the top spot. Ten years ago, the company’s market cap stood at $79.54 billion. Apple currently has a market cap of $626 billion — a ten-year gain of more than half a trillion dollars. Not too shabby.
The Closer 1/10/17 – Return Of Producer Price Inflation
Log-in here if you’re a member with access to the Closer.
Looking for deeper insight on global markets and economics? In tonight’s Closer sent to Bespoke Institutional clients, we review the global acceleration of producer price inflation with two charts and a heatmap. We also take a look at the related increase in wholesale sales in the US, and – again related – the rationalization of inventory/sales ratios.
The Closer is one of our most popular reports, and you can see it and everything else Bespoke publishes by starting a no-obligation 14-day free trial to our research!
Bespoke Briefs — Futures Curves — January 2017
Chart of the Day: Dogs of the Nasdaq 100
B.I.G. Tips – Low Quality, High Performance
A Breakout Month for Bespoke’s Consumer Pulse Report
Each month, Bespoke runs a survey of 1,500 US consumers balanced to census. In the survey, we cover everything you can think of regarding the economy, personal finances, and consumer spending habits. We’ve now been running the monthly survey for more than two years, so we have historical trend data that is extremely valuable, and it only gets more valuable as time passes. All of this data gets packaged into our monthly Bespoke Consumer Pulse Report, which is included as part of our Pulse subscription package that is available for either $39/month or $365/year. We highly recommend trying out the service, as it includes access to model portfolios and additional consumer reports as well. If you’re not yet a Pulse member, click here to start a 30-day free trial now!
In our just-published monthly Bespoke Consumer Pulse Report, we paid close attention to our proprietary financial and economic sentiment readings. This was the first monthly survey that we conducted in full post-election, and we wanted to see how our survey data compared to the extremely bullish sentiment readings we’ve seen in standard economic indicators like Consumer Confidence, NIFB Small Business, NAHB Homebuilder Sentiment, etc. Over the next few days and weeks we’ll be highlighting data from this month’s report that we found to be extremely insightful for the future path of the US economy. Once again, if you’re not yet a Pulse member and want to see this month’s FULL report, click here to start a 30-day free trial now!
In today’s post we take a look at three charts that focus on consumers’ personal financial situations. The first chart shows our proprietary tracker for a question we ask respondents about how their current income compares to their income one year ago. After showing some deterioration last month, the quick improvement sequentially seems to have resolved itself and our reading for December hit its highest levels on record. While income growth is still relatively modest overall, the new high after years in a range is a huge move.

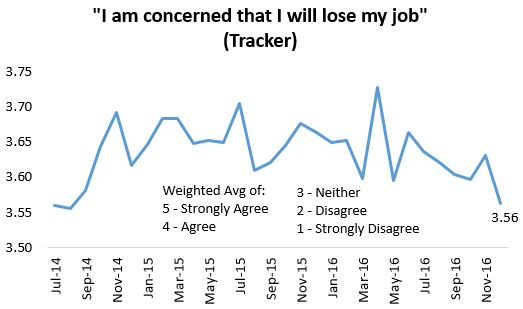
The second chart shows the results from a survey question asking consumers if they’re concerned that they will lose their job. As you can see, job loss concerns hit their lowest levels since August 2014 in our December Pulse survey.
Finally, the last chart shows the results of three questions we ask regarding financial conditions. All of the financial condition series we track made a big positive turn in December, rising to either multi-year highs or the best levels we’ve ever recorded depending on the specific question. This is a significant turn of events that should have a positive impact on GDP in the coming quarters.

ETF Trends: US Sectors & Groups – 1/10/17
Gold and gold miners continue to rally and a number of overseas indices have also gained in the past week along with metals, biotech, and silver. Turkey and Mexico, beholden to beleaguered currencies that continue to plunge versus the dollar, have undeperformed, as has high-beta crude oil exposure and the energy complex more broadly.

Bespoke provides Bespoke Premium and Bespoke Institutional members with a daily ETF Trends report that highlights proprietary trend and timing scores for more than 200 widely followed ETFs across all asset classes. If you’re an ETF investor, this daily report is perfect. Sign up below to access today’s ETF Trends report.
See Bespoke’s full daily ETF Trends report by starting a no-obligation free trial to our premium research. Click here to sign up with just your name and email address.
Bespoke Stock Scores: 1/10/17
Small Business Optimism Surges
Get Bespoke’s 2017 Outlook Report with a 30-day free trial to Bespoke’s premium research! Click here to learn more.
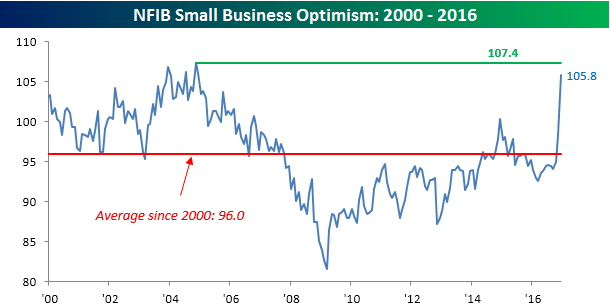
Add small business optimism to the list of sentiment surveys surging in the wake of November’s election as this month’s sentiment survey from the NFIB launched higher in December. According to the NFIB, its index of small business optimism surged to 105.8 from 98.4 in November and expectations of 99.1. As highlighted in today’s Morning Lineup, it was the 5th highest monthly reading in the history of the survey (going back to the 1970s) and the best reading since December 2004. Relative to expectations, it was also the best reading we have seen since at least 2009. With the caveat that the NFIB has a tendency to lean conservative, today’s report suggests that small business sentiment has kicked into a higher gear.
Almost all of the improvement in sentiment was driven by expectations rather than actual conditions in the field, though. As noted in the report, “Seventy-three percent of the gain in the Index was accounted for by more positive views about business conditions six months from December and improvements in real sales volumes. Improved views about the climate for expansion added another 15 percent, so more optimistic expectations account for 88 percent of the Index’s improvement, indicating little improvement in the other seven components and more importantly in the measures directly related to economic growth.”
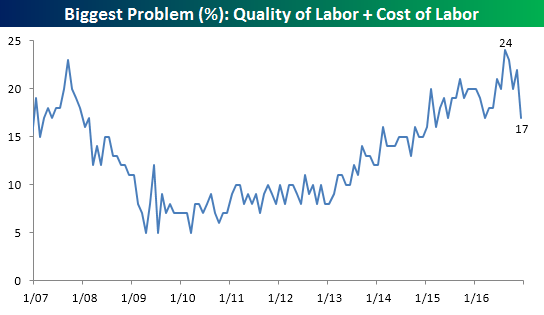
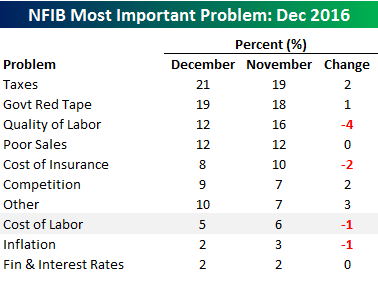 As we do each month, the table to the right lists which issues small business owners consider to be their biggest problems. In this month’s report, the ‘old-reliables’ of Taxes and Government Red Tape top the list at 21% and 19%, respectively, and both also saw an increase in December. On the downside, Quality of Labor (-4) showed the largest decline followed by Cost of Insurance (-2), Cost of Labor (-1), and Inflation (-1).
Along with the fact that business owners are getting more optimistic, labor issues have become an increasingly less pressing issue. The chart below shows the historical combined percentage of businesses citing cost and quality of labor as their number one problems. Back in August, this reading surged to an all-time high of 24%. In just the last four months. though, it has declined to 17%, which is tied for the lowest reading since March 2015. If in fact small business sentiment about the future is accurate, one would expect to see labor cost and quality issues start to become more problematic as hiring increases.