ETF Trends: US Indices & Styles – 4/17/17
Steel, metals and mining, and banks continue to provide the worst returns in the ETF universe we track. Energy companies have also suffered. The best performers have come from South Africa, Turkey (where President Erdogan won a referendum expanding his presidential powers over the weekend), long-term bonds, and precious metals.

Bespoke provides Bespoke Premium and Bespoke Institutional members with a daily ETF Trends report that highlights proprietary trend and timing scores for more than 200 widely followed ETFs across all asset classes. If you’re an ETF investor, this daily report is perfect. Sign up below to access today’s ETF Trends report.
See Bespoke’s full daily ETF Trends report by starting a no-obligation free trial to our premium research. Click here to sign up with just your name and email address.
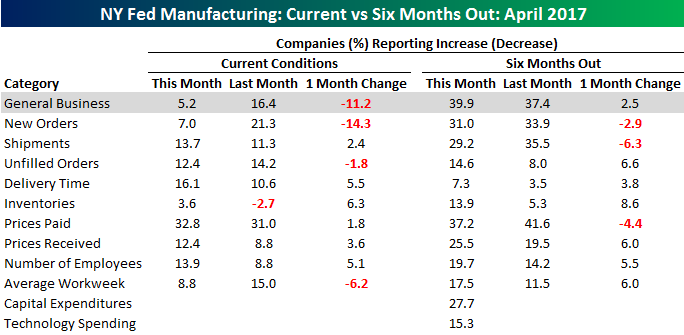
Empire Manufacturing Drops to Lowest Level Since November
Today’s Empire Manufacturing report for the month of April came in weaker than expected on the headline reading, but the report wasn’t all bad. While economists were forecasting the headline index to come in at a level of 15.0 from last month’s reading of 16.4, the actual reading was 5.2, or the lowest reading since November. Digging a little bit deeper into the report, though, while current General Business conditions declined, expectations for six months from now actually saw a slight increase. Additionally, as shown in the lower chart, plans for both Capital Expenditures and Technology Spending increased. In the case of Cap Ex, that reading hit a two-plus year high.

The table below breaks down this month’s report by each of the individual categories. As shown, breadth was relatively strong as the majority of the weakness in current conditions was in New Orders and to a lesser degree, Average Workweek, and Unfilled Orders.
Start a 14-day free trial to unlock all of Bespoke’s market analysis.
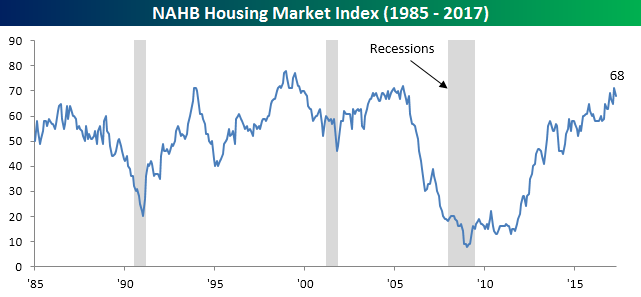
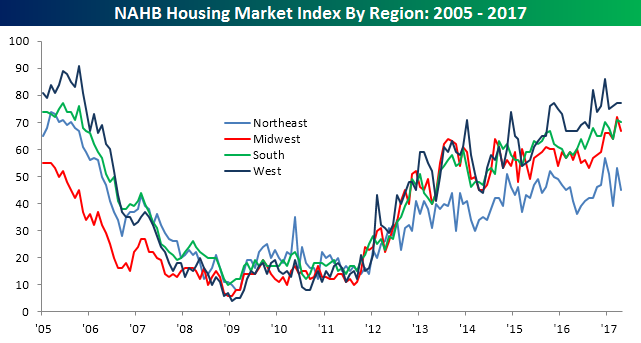
Homebuilder Sentiment Backs Off From Multi-Year Highs
After a surge to new multi-year highs in March, homebuilder sentiment for April backed off a bit more than expected. While economists were expecting the headline reading in sentiment to fall down one notch from 71 to 70, the actual decline was three ticks to 68. Looking at the long-term chart, however, it’s hard to get too concerned about this reading at this point as it barely registers as even a blip. Longer term, the trend in sentiment is still positive.
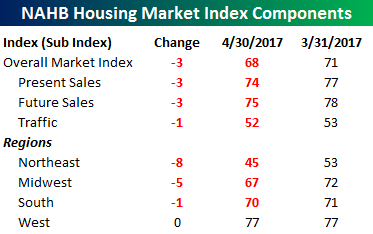 The table to the right breaks down this month’s report by Present and Future Sales, Traffic, and regional sentiment. Both Present and Future Sales were down by equal amounts in April, and Traffic saw just a modest decline. On a regional basis, outside of the West region where sentiment is the strongest, homebuilders in the rest of the country are all a bit less optimistic this month than they were in March.
Start a 14-day free trial to unlock all of Bespoke’s financial markets analysis.
Bespokecast Episode 9 — Charles Kirk — Now Available on iTunes, GooglePlay, Stitcher and More
 We’re happy to announce that the newest episode of Bespokecast is now available to the general public both here and via the various podcast platforms. Be sure to subscribe to Bespokecast on your preferred podcast app to gain access to our full collection of episodes. We’d also love for you to provide a review as well!
In our newest conversation on Bespokecast, we spoke with trading legend Charles Kirk — trader and author of The Kirk Report. Charles has been a leading commentator and analyst of US equity markets since the early 2000s, and he has a long history of collaboration with other investors and analysts, including our firm. We were thrilled to have him on to talk about his career, his unique blend of technical and fundamental analysis, what has helped shape his approach to investing, and how he views the current equity market.
During our conversation, Charles discusses the longer-term pattern currently driving the S&P 500; you can see that chart here. We also spoke with Charles about the advantages of working in the Hawaiian time zone, his passion for pickleball and golf, and the collaborative approach which has helped him find success in the markets. We hope you enjoy the conversation as much as we did!
Listeners can read about or contact Charles directly through his website or at his wiki page.
Each new episode of our podcast features a special guest to talk markets with, and Bespoke subscribers receive special access before it’s made available to the general public. If you’d like to try out a Bespoke subscription in order to gain access to these podcasts in advance, you can start a two-week free trial to check out our product. To listen to episode 9 or subscribe to the podcast via iTunes, GooglePlay, OvercastFM, or Stitcher, please click below.

Bespoke Brunch Reads: 4/16/17
Welcome to Bespoke Brunch Reads — a linkfest of the favorite things we read over the past week. The links are mostly market related, but there are some other interesting subjects covered as well. We hope you enjoy the food for thought as a supplement to the research we provide you during the week.
Booms (For Now)
This Trend is Happening Now Across All 50 of the United States by Jigar Shah (Unreasonable)
A quick summary of the exploding growth of the solar industry, especially in terms of job creation where it is virtually unmatched despite flying decidedly below the radar in recent policy discussions. [Link]
A day of insanity that typifies Toronto’s housing market by Meagan Campbell (Maclean’s)
Home prices up by almost 30% YoY? Surging interest in speculation? Massive conferences featuring Tony Robbins and Pitbull? Welcome to the wild world of Southern Ontario real estate. [Link]
Busts (Maybe Later)
Sir Tim Berners-Lee lays out nightmare scenario where AI runs the financial world by Scott Carey (Techworld)
Will AIs chasing each other’s tails into an endless loop of trading and counter-trading be how financial markets work in the glorious future? [Link]
DALIO: ‘I’m worried about what the next downturn might look like’ by Rachael Levy (Business Insider)
Somewhat unsurprisingly for a man running one of the largest fixed income portfolios in history, Bridgewater’s Dalio thinks rates might go down. [Link]
This Week In Airlines
United Airlines passenger claims scorpion stung him on flight to Canada by Ashifa Kassam (The Guardian)
It turns out that the “re-accommodation” of Peter Dao wasn’t the only unfortunate incident on a United flight this week. [Link]
Not So Fast: Would 3rd Runway on Rikers Island Alleviate LaGuardia’s Ailments? by Phik Derner Jr. (NYC Aviation)
Supplemental capacity for LGA after the closure of the Rikers prison would not help improve the mess that is New York City’s aviation landscape. [Link]
Diversions
The Stats of the Furious (Bloomberg)
An amusing array of charts, graphs, and anecdotes surveying the 7-film franchise’s history on the big screen. [Link]
When Pixels Collide (Sudoscript)
What happens when you give a massive blank canvas of pixels to Reddit? A fascinating story of spontaneous order, human ambition, and online culture. [Link]
Learning
How a Browser Extension Could Shake Up Academic Publishing by Lindsay McKenzie (The Chronicle of Higher Education)
Unpaywall is hoping to provide instant access to non-gated versions of academic research as users browse over sites offering paid versions of the same material. [Link]
Teachers cash in, big time, by putting lessons up for sale by Carolyn Thompson (Yahoo!/AP)
Commanding revenues in the millions, teachers are sharing their most effective lesson plans across the internet and adding supplemental income. [Link; auto-playing video]
Amazon
Amazon Said to Mull Whole Foods Bid Before Jana Stepped In by Spencer Soper and Craig Giammona (Bloomberg)
Combining two of the buzziest (if not most profitable) consumer brands out there was reportedly a possibility in recent weeks; Whole Foods is still being prompted to sell itself by Jana Partners. [Link]
How Amazon Go (probably) makes “just walk out” groceries a reality by Haomiao Huang (Ars Technica)
Restaurants without cashiers and no need to actually offer payment before leaving the store involve a number of technical advances used in combination. [Link]
Weird News
Oregon may lift constitutional ban on dueling by Jazz Shaw (Hot Air)
Removing a constitutional ban on dueling is fortunately not going to lead demands for satisfaction and discharged rounds at 10 paces. [Link]
The Philippines
A Businessman’s Murder Unmasks a Web of Violent Police by Eun-Young Jeong and James Hookway (WSJ)
The horrifying tale of an innocent South Korean businessman’s demise at the hands of police in the violence-wracked anti-drug regime of Rodrigo Duterte, the President of the Philippines. [Link; paywall]
Consumer Defaults
Why young rich dudes say they’re about to default: [shrug] by Alexandra Scaggs (FT Alphaville)
Almost 40% of consumers expecting to default on a loan payment in the next 12 months offer “no specific reason”; most of those consumers are higher income and relatively upwardly mobile. [Link; registration required]
Washington
Trump’s budget director on what’s on, and off, the table for cuts by John Harwood (CNBC)
An interest bit of insight into possible policy priorities for the Trump administration below the principals level. [Link; auto-playing video]
Endowments
Yale Endowment Blasts Low-Fee Critics, Says Gains Would Lag by Janet Lorin (Bloomberg)
In a sharp pushback against endowment peers that have started switching towards passive investment vehicles, Yale claims their active portfolio’s returns justify its fees. [Link]
Have a great Sunday!
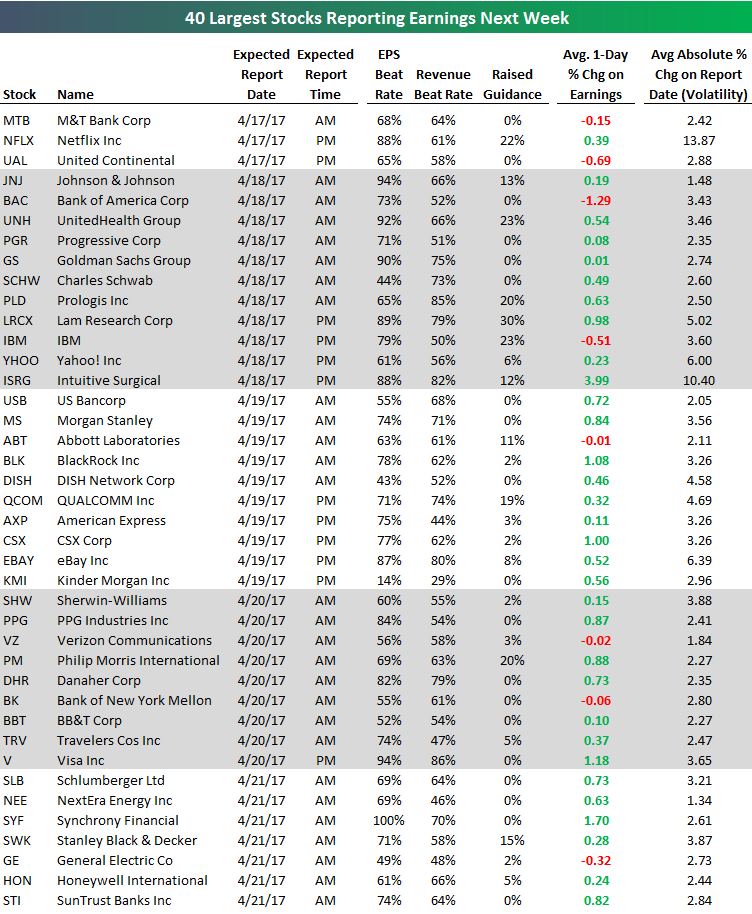
Here’s the Most Important Earnings Reports to Watch (4/17-4/21)
The first quarter 2017 earnings reporting period kicks into full gear next week. Below is a list of the 40 largest companies scheduled to report pulled from our Interactive Earnings Season Calendar. Next to each stock, we include its historical EPS and revenues “beat rates” along with the % of time it has raised guidance. The “beat rates” are simply the percentage of the time the company has beaten analyst earnings or revenue estimates going back to 2001. We also include the stock’s average one-day move on its earnings reaction day (the first trading day following quarterly earnings) and its average absolute move (measures earnings day volatility).
Netflix (NFLX) and United (UAL) are set to report on Monday after the close, while on Tuesday we’ll hear from a number of Dow stocks — JNJ, UNH, GS, IBM. On Wednesday morning we get results from Morgan Stanley (MS) followed by QUALCOMM (QCOM), American Express (AXP), CSX and eBay (EBAY) after the close. Thursday’s biggest companies include Verizon (VZ), Philip Morris (PM), Travelers (TRV) and Visa (V), while Schlumberger (SLB), General Electric (GE), and Honeywell (HON) round out the week with reports on Friday.
Of the stocks set to report next week, Netflix (NFLX) is by far the most volatile, while Intuitive Surgical (ISRG) has historically averaged the best earnings reaction day returns. Bank of America (BAC) has actually been the worst performer of the bunch on earnings.
Start a 14-day free trial to see all of Bespoke’s premium earnings season analysis.
S&P 500 Quick View Chart Book : 4/15/17
The Closer — Easter Seasonality — 4/13/17
Log-in here if you’re a member with access to the Closer.
Looking for deeper insight on global markets and economics? In tonight’s Closer sent to Bespoke Institutional clients, we look at the seasonality of the ten year note and US dollar index around Easter.

The Closer is one of our most popular reports, and you can sign up for a free trial below to see it!
The Closer is one of our most popular reports, and you can see it and everything else Bespoke publishes by starting a no-obligation 14-day free trial to our research!
Bespokecast — Episode 9 — Charles Kirk
In our newest conversation on Bespokecast, we spoke to Charles Kirk — trader and author of The Kirk Report. Charles has been a leading commentator and analyst of US equity markets since the early 2000s, and he has a long history of collaboration with other investors and analysts, including our firm. We were thrilled to have him on to talk about his career, his unique blend of technical and fundamental analysis, what has helped shape his approach to investing, and how he views the current equity market.
During our conversation, Charles discusses the longer-term pattern currently driving the S&P 500; you can see that chart here. We also spoke with Charles about the advantages of working in the Hawaiian time zone, his passion for pickleball and golf, and the collaborative approach which has helped him find success in the markets. We hope you enjoy the conversation as much as we did!
Listeners can read about or contact Charles directly through his website or at his wiki page.
To access Episode 9 immediately, please start a 14-day free trial to Bespoke’s research product. If you’ve already signed up for a Bespoke free trial in the past, you can gain access by choosing a membership option at our products page. Here’s a look at past guests if you’re interested.

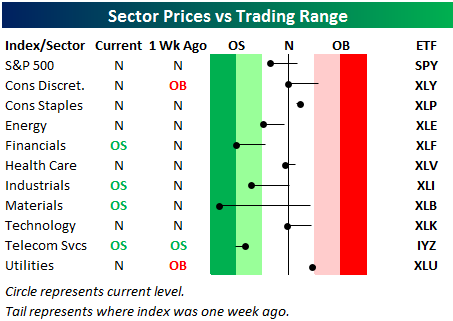
Bespoke’s Sector Snapshot — 4/13/17
We’ve just released our weekly Sector Snapshot report (see a sample here) for Bespoke Premium and Bespoke Institutional members. Please log-in here to view the report if you’re already a member. If you’re not yet a subscriber and would like to see the report, please start a 14-day trial to Bespoke Premium now.
Below is one of the many charts included in this week’s Sector Snapshot, which highlights our trading range screen for the S&P 500 and ten sectors. The black vertical “N” line represents each sector’s 50-day moving average, and as shown, most sectors are now below their 50-DMAs. Four of ten are actually in oversold territory, while none are overbought. (Note that the red zone in the screen is considered overbought territory, while the green zone is considered oversold territory.)
To see our full Sector Snapshot with additional commentary plus six pages of charts that include analysis of valuations, breadth, technicals, and relative strength, start a 14-day free trial to our Bespoke Premium package now. Here’s a breakdown of the products you’ll receive.