May 2017 Asset Class Performance
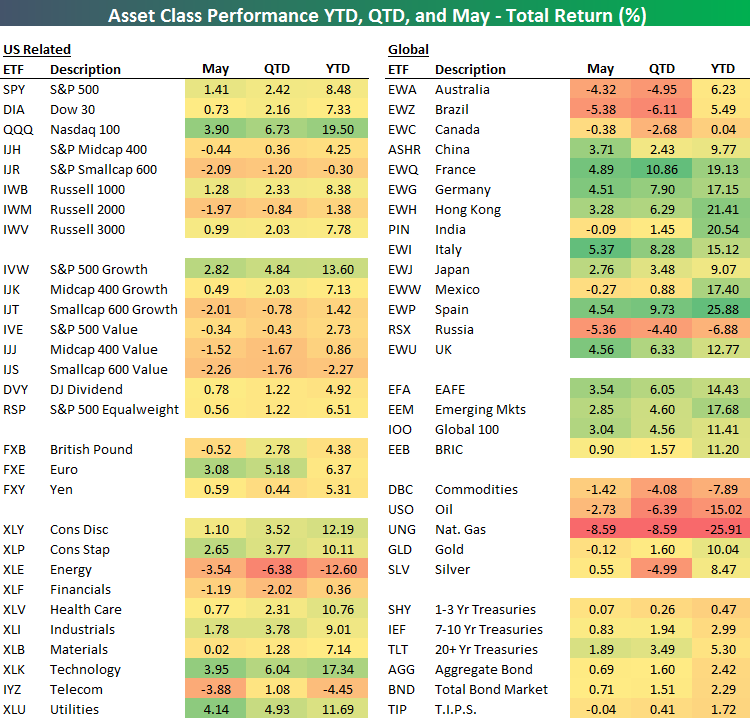
May 2017 is now in the books, and below is a look at the performance of various asset classes during the month using key ETFs traded on US exchanges. We also include YTD and QTD total returns for each ETF.
The Nasdaq 100 (QQQ) was the best performer of the major US equity index ETFs in May, posting a gain of 3.9%. The S&P 500 (SPY) gained 1.41%, while the Dow 30 (DIA) gained just 0.73%. Notably, small caps (IWM) and mid caps (IJH) were down on the month. While the Nasdaq 100 (QQQ) is up 19.5% YTD, the S&P Smallcap 600 (IJR) is actually in the red this year. That’s a huge disparity.
There was quite a bit of divergence between sectors in May as well. Energy (XLE), Financials (XLF), and Telecom (IYZ) all fell, while Utilities (XLU) and Technology (XLK) were up roughly 4%.
Outside of the US, the three countries that finished deeply in the red in May were Australia (EWA), Brazil (EWZ), and Russia (RSX). All three were down more than 4.3%. Canada (EWC), Mexico (EWW), and India (PIN) were down minimally, and the rest of the countries in the matrix were solidly in the green. Italy (EWI), France (EWQ), and the UK (EWU) were up the most with gains of more than 4.5%.
Looking at commodities, oil (USO) and natural gas (UNG) both fell in May, while gold (GLD) and silver (SLV) were roughly flat. Treasury ETFs were marginally in the black.
Bullish Sentiment Declines…Again
The dour mood of individual investors continued once again this week as the latest sentiment poll from AAII showed another sizable drop in bullish sentiment. In this week’s survey, bullish sentiment declined from 32.86% down to 26.92%. There’s not much to say here besides the fact that bullish sentiment has been below 50% for a record 126 straight weeks.
Start a two-week free trial to Bespoke Institutional today.

Bearish sentiment ticked slightly higher in this week’s survey rising from 30.0% up to 31.54%. This is now the sixth week in the last ten that bearish sentiment has exceeded bullish sentiment. Yes, bears outnumbered bulls this week, but indecision continues to reign as 41.54% of individual investors considered themselves neutral on the market. Guess no one wants to make a stand anymore.

Jobless Claims Hit a Five Week High
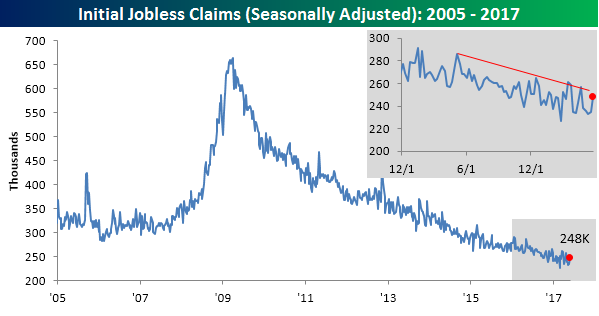
While the ADP report for May was better than expected, jobless claims saw their largest one-week increase in more than a month. While economists were expecting claims to rise slightly from 235K up to 238K, the actual increase was 10K more at 248K. While this week’s level marks a five-week high, it is still the 117th straight week of sub 300K claims. Also, anytime claims are below 250K, it is hard to get too concerned even if the print was higher than expected.
Start a two-week free trial to Bespoke Institutional today.
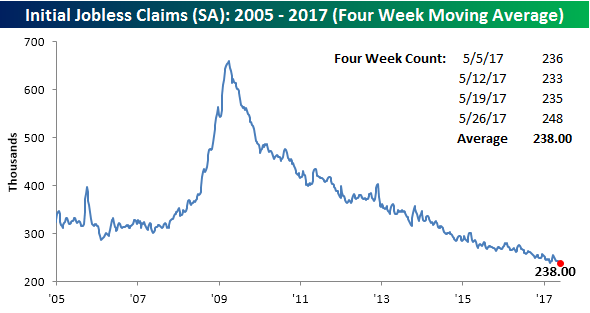
With this week’s increase, the four-week moving average increased from its cycle low of 235.5K last week to 238K. Last week, we said that it would take a much larger than expected reading this week in order to not make another cycle low, and unfortunately, that’s just what we got this week.
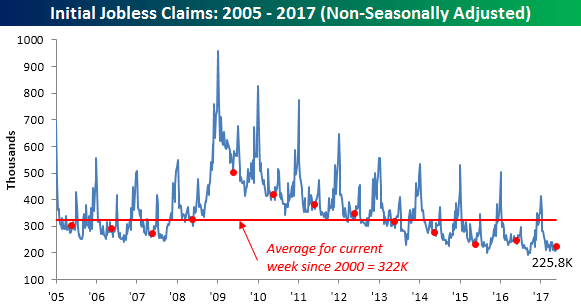
On a non-seasonally adjusted basis (NSA), claims rose from 210.4K up to 225.5K. While that’s up from last week, once again it is well below the average of 322K for the current week of the year dating back to 2000 and the lowest reading for the current week of the year since 1973.
The Closer — Q1 Growth & Debt North of the Border — 5/31/17
Log-in here if you’re a member with access to the Closer.
Looking for deeper insight on global markets and economics? In tonight’s Closer sent to Bespoke Institutional clients, we dive deep into the latest Canadian GDP data.

The Closer is one of our most popular reports, and you can sign up for a free trial below to see it!
The Closer is one of our most popular reports, and you can see it and everything else Bespoke publishes by starting a no-obligation 14-day free trial to our research!
Chart of the Day: May 2017 Decile Analysis
B.I.G. Tips – June 2017 Seasonality
B.I.G. Tips – Margin Debt Hits Another Record High. How Worried Should You Be?
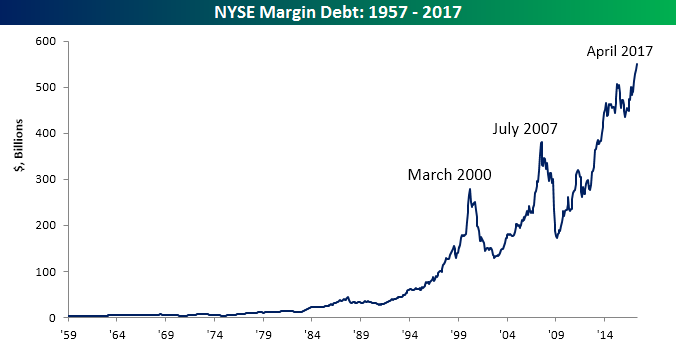
Margin debt for the month of April was released at the end of last week, and at a level of $549.2 billion, it hit its fourth straight record high in a row. Record levels of margin debt are traditionally considered a negative signal for equity prices as they imply that investors are leveraged to the hilt and everyone that is going to get in the pool is already swimming. Charts like the one below only exacerbate the angst that surrounds record levels of margin debt. Back in March 2000 and then again in July 2007, margin debt levels peaked at record highs and not long thereafter the S&P 500 went on to get cut in half! Also, if you squint real hard you can also see that margin debt looks to have made a peak back in the summer of ’87 right before the stock market crash as well.
So, how good of an indicator is margin debt in terms of forward market returns. In a B.I.G. Tips report published today, we looked back at historical levels of margin debt and what, if anything, record levels said about future returns. For anyone interested in how margin debt levels might impact equity prices going forward, this report is a must read. To see the report, sign up for a monthly Bespoke Premium membership now!
ETF Trends: US Indices & Styles – 5/31/17
Long-term Treasuries have outperformed over the last week with low volatility, momentum, and consumer-related stocks driving US equity performance higher. On the losing side of the slate, oil and energy-related ETFs continue to lag badly.

Bespoke provides Bespoke Premium and Bespoke Institutional members with a daily ETF Trends report that highlights proprietary trend and timing scores for more than 200 widely followed ETFs across all asset classes. If you’re an ETF investor, this daily report is perfect. Sign up below to access today’s ETF Trends report.
See Bespoke’s full daily ETF Trends report by starting a no-obligation free trial to our premium research. Click here to sign up with just your name and email address.
Fixed Income Weekly – 5/31/17
Searching for ways to better understand the fixed income space or looking for actionable ideals in this asset class? Bespoke’s Fixed Income Weekly provides an update on rates and credit every Wednesday. We start off with a fresh piece of analysis driven by what’s in the headlines or driving the market in a given week. We then provide charts of how US Treasury futures and rates are trading, before moving on to a summary of recent fixed income ETF performance, short-term interest rates including money market funds, and a trade idea. We summarize changes and recent developments for a variety of yield curves (UST, bund, Eurodollar, US breakeven inflation and Bespoke’s Global Yield Curve) before finishing with a review of recent UST yield curve changes, spread changes for major credit products and international bonds, and 1 year return profiles for a cross section of the fixed income world.
In this week’s note, we explain why the Fed’s balance sheet will not return to the pre-crisis size, also discussing a US rates trade idea.
Our Fixed Income Weekly helps investors stay on top of fixed income markets and gain new perspective on the developments in interest rates. You can sign up for a Bespoke research trial below to see this week’s report and everything else Bespoke publishes free for the next two weeks!
Click here to start your no-obligation free Bespoke research trial now!
Looking for Action? S&P 1500 Most Volatile Stocks
For traders with a short-term time horizon who are looking for big moves over a short period, we have updated our list of the S&P 1500 stocks trading above $10 that have the largest intraday high-low ranges (based on the average percent spread between the intraday high and low over the last 50 days). The stocks are grouped based on whether they have a rising or falling 50-day moving average (DMA). Stocks highlighted in gray are new to the list since our last update.
As overall volatility in the market has been vanishing, the percentage of individual stocks experiencing large daily moves in the last two months has also shrunk, and in this month’s update to our list of most volatile stocks, there are only eleven names that have experienced average daily moves of more than 5%. In terms of uptrends versus downtrends, it is interesting to note that of the 50 names shown, just 19 have rising 50-day moving averages while 31 have 50-DMAs that are declining.
Apropos of its ticker, the title for most volatile stock in the S&P 1500 this month belongs to Olympic Steel, whose ticker symbol is ZEUS! Over the last 50 trading days, the stock has had an average daily high/low range of 6.0%, although with a share price of just $16.72, that only works out to a range of about a dollar. The highest priced stock on this month’s list is Stamps.com (STMP). With its share price of $135.35, STMP sees an average daily range of over $6.
Finally, in terms of sector representation, Health Care has the most names listed this month with 11, followed by Industrials (9), and then Consumer Discretionary (8). Sectors with no representation are Consumer Staples, Real Estate, Telecom Services, and Utilities.
Start a two-week free trial to Bespoke Institutional today.
