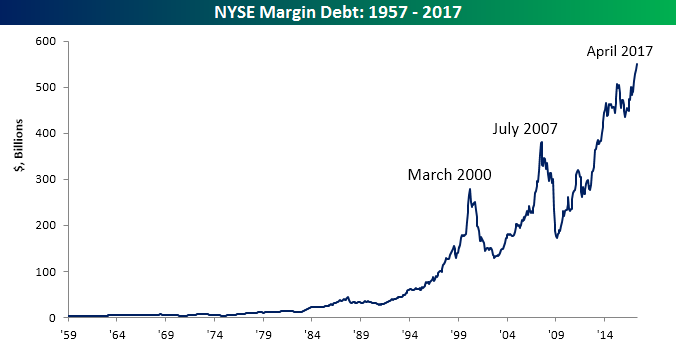
Margin debt for the month of April was released at the end of last week, and at a level of $549.2 billion, it hit its fourth straight record high in a row. Record levels of margin debt are traditionally considered a negative signal for equity prices as they imply that investors are leveraged to the hilt and everyone that is going to get in the pool is already swimming. Charts like the one below only exacerbate the angst that surrounds record levels of margin debt. Back in March 2000 and then again in July 2007, margin debt levels peaked at record highs and not long thereafter the S&P 500 went on to get cut in half! Also, if you squint real hard you can also see that margin debt looks to have made a peak back in the summer of ’87 right before the stock market crash as well.
So, how good of an indicator is margin debt in terms of forward market returns. In a B.I.G. Tips report published today, we looked back at historical levels of margin debt and what, if anything, record levels said about future returns. For anyone interested in how margin debt levels might impact equity prices going forward, this report is a must read. To see the report, sign up for a monthly Bespoke Premium membership now!