B.I.G. Tips – Years Like 2017: August Edition
Yesterday’s trading session represented the 150th trading day of 2017, and so far investors have nothing to complain about. With a gain of 10.7% through 8/7, 2017 ranks as the fourth best start to a year in the last ten years, behind 2013 (18.6%), 2009 (11.9%) and 2012 (11.4%). Earlier today, we took a look at years that had the most similarity to 2017 in terms of the pattern of daily closing prices to see which years since 1928 have the greatest similarity to 2017, and more importantly, how the S&P 500 performed for the remainder of each of those years.

The results of the analysis showed a clear trend in the market’s performance for the remainder of the year. For instant access, sign up for a monthly Bespoke Premium membership now!
Small Business Confidence Bounces Back
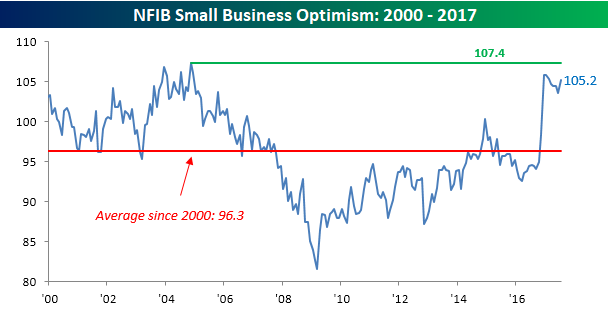
After five straight months of declining or flat readings in small business optimism, July’s update from the NFIB showed a big turnaround. With economists expecting the headline index to come in at a level of 103.5, the actual reading came in at 105.2. This puts the index back within a point of its cycle high and indicates that despite a lack of progress in DC, small business owners are seeing improved conditions on the ground. The commentary of the report said as much when it stated that, “Apparently economic activity in the second quarter was good enough to divert owner attention from the impotence of Washington lawmakers. There’s nothing like more customers to make owners happy, and optimism held up as did important measures of spending and hiring plans. Congress still holds the key to faster growth, so let’s hope they open the door.”
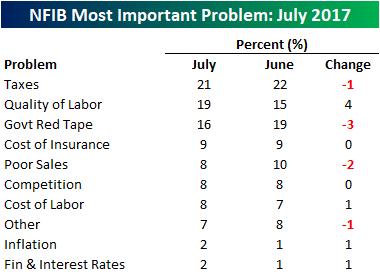
The table below summarizes the issues that small business owners consider to be the biggest problems facing their operations. Topping the list once again this month is Taxes, which was cited by 21% of respondents. Taking the number two spot this month was Quality of Labor, which saw the largest increase and was cited by 19% of business owners. Number three on the list was Government Red Tape, which declined from 19% down to 16%. The only other notable decliner was Poor Sales, as just 8% of small business owners are having a hard time generating sales.
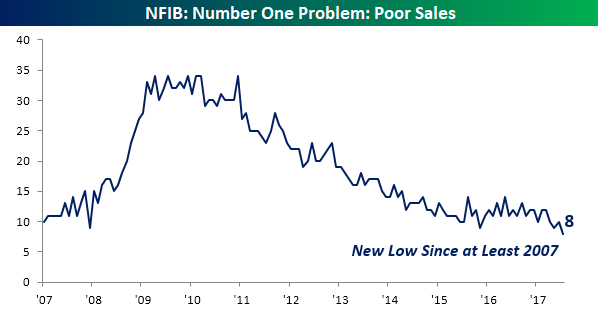
A few charts from the table above are worth highlighting. First, when it comes to the problem of Poor Sales, there really isn’t one. Going back to at least 2007, there have never been fewer small businesses citing Poor Sales as a problem. From one perspective, this is encouraging, but one could argue that it would be hard for things to get much better than they are now.
One of the biggest issues facing workers during this expansion has been the lack of meaningful wage growth. While we feel as though calling for higher wage growth around the corner is reminiscent of Waiting for Godot, small business owners are increasingly citing labor issues as their number one problem, and in theory, at least, that should translate to higher wages. In this month’s report, 19% of small business owners cited Quality of Labor as their number one issue, and that’s tied for the highest reading on record and an increase of four percentage points from last month.

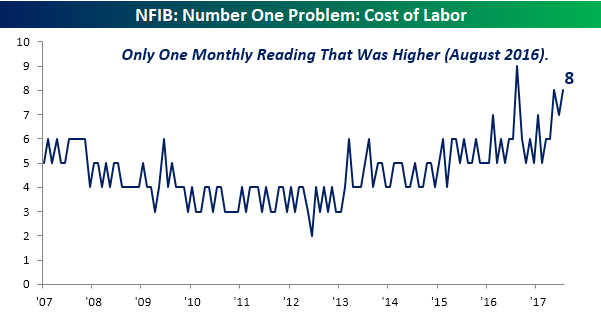
When labor quality is lacking, employers tend to have to pay up for higher quality labor, and that is showing up in the percentage of small business owners citing the cost of labor as their number one issue. In this month’s survey, that percentage ticked up to 8%. Since 2007, there has only been one other month where more businesses cited labor costs as their biggest problem (August 2016).
Bespoke’s Post-Market Closer — Lots of Bubble Talk Lately — 8/7/17
Log-in here if you’re a member with access to the Closer.
Looking for deeper insight on global markets and economics? In tonight’s Closer sent to Bespoke Institutional clients, we focus on all of the “bubble” chatter we’ve been hearing lately regarding the stock market and the Tech sector more specifically. The chart below is one of many included in tonight’s report that compares the current bull market that began on 3/9/09 to the longest bull market on record that ran from December 1987 through March 2000.

The Closer is one of our most popular reports, and you can sign up for a free trial below to see it!
See today’s post-market Closer and everything else Bespoke publishes by starting a no-obligation 14-day free trial to our research platform!
It Depends on What Your Definition of Narrow Is
One of the more popular articles making the rounds today concerns the rally in Hong Kong equities and the scope of the rally in its Hang Seng Index. According to the article, the Hang Seng’s rally has been concentrated among just a handful of names. For example, Tencent Holdings 69 percent gain this year “has accounted for about a quarter of the index’s gain.” The article goes on to quote strategists warning that the “lack of breadth” in the Hang Seng is a red flag for the index.
We’ll be the first to agree that any rally showing a lack of breadth is a warning sign to the overall rally’s sustainability. The only issue we have with critiques of breadth in the Hang Seng is that breadth has actually been strong. The chart below compares the price of the Hang Seng to its cumulative A/D line, which is simply a cumulative measure of the number of stocks in the index rising on a daily basis minus the number of stocks falling on a daily basis. As shown in the chart, price and breadth in the index have been tracking each other very closely over the last twelve months, and just today, as the index’s price hit a new high, so too did the cumulative A/D line. The fact that breadth in the Hang Seng has been confirming the new highs in the price of the index illustrates the fact that breadth has been solid and not narrow.
The argument regarding Tencent and its impact on the performance of the Hang Seng reminds us of one we have been hearing all year with regards to the S&P 500 and the disproportionate impact that the largest stocks in the index have had on its performance. We can’t and won’t dispute the fact that in both cases these largest stocks are accounting for a large share of the gains, but the reason we aren’t overly concerned is that other smaller stocks in the index have been participating as well. If a situation arises where the largest stocks continue to rally while the rest of the market falters, we would be worried, but at this point, that is not the case.

ETF Trends: US Indices & Styles – 8/7/17
DJIA New Closing Highs By Year
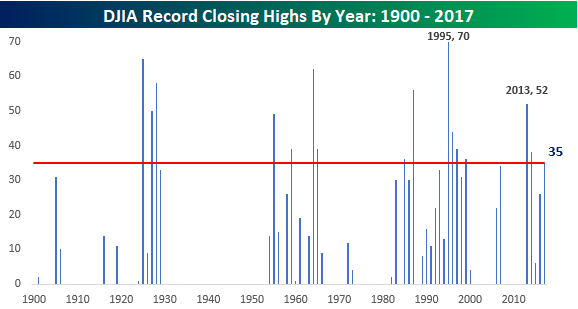
The DJIA came into the week riding a streak of eight straight trading days of record closing highs and is currently on pace for a ninth straight record close. Including today, the index has now seen 35 record closing highs so far in 2017. The first chart below compares this year’s total number of closing highs to the number of closing all-time highs by year going back to 1900. Looking at the chart, several years have seen a lot more closing highs. As recently as 2014, the DJIA saw 38 record closes and the year before that there were 52. The record number of closing highs for a given year was back in 1995 when there were 70. If the DJIA were to go the remainder of the year without notching another closing high, 2017 would rank as the 16th most record closes in a given year since 1900.
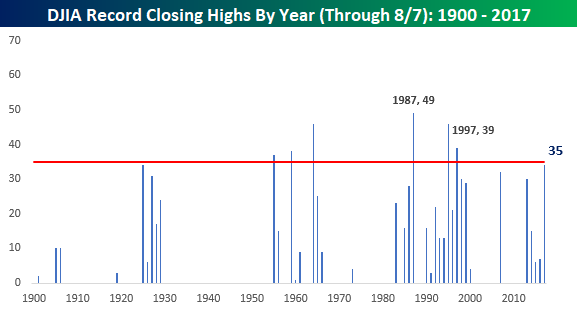
The year may be going fast, but we all know that there are still another 4+ months before 2017 comes to an end, so while nothing is guaranteed, there’s still plenty of room for this year to add to the total of new highs. With that in mind, the chart below shows the number of record closing highs for the DJIA by year only through 8/7. Using this apples to apples comparison, 2017’s total looks a lot more impressive as the 35 total record closing highs would rank as the 7th most all time and the most since 1997 when there were 39. Two years before that, there were 46 in 1995, but the record number of closing all time highs for the DJIA through 8/7 was 49 back in 1987. In that year, though, there were only seven more record closing highs before the bottom started to fall out of the market ahead of one of the fifth worst final four months of a year for the DJIA in its history.
Bespoke Stock Seasonality: 8/7/17
Chart of the Day: DJIA Streaks of Record High Closes
Bespoke Brunch Reads: 8/6/17
Welcome to Bespoke Brunch Reads — a linkfest of the favorite things we read over the past week. The links are mostly market related, but there are some other interesting subjects covered as well. We hope you enjoy the food for thought as a supplement to the research we provide you during the week.
See this week’s just-published Bespoke Report newsletter by starting a no-obligation two-week free trial to our premium research platform.
Banking
Banking regulator kicks of Volcker Rule rewrite process by Pete Schroeder (Reuters)
Public comments on a revised rulemaking for the Dodd-Frank Act’s Volcker Rule ban on proprietary trading are back under way. [Link]
How China’s biggest bank became ensnared in a sprawling money laundering probe by Angus Berwick and David Lague (Reuters)
A sprawling read on the long process of busting money laundering organized criminals who funneled billions back to China from illegal imports into Spain. [Link]
Financial Products
Sneak Preview in the Works for Timing of U.S. Libor Alternative by Alex Harris (Bloomberg)
Libor is being replaced, with the bank poll of overnight funding rates being still yet to find a substitute benchmark for the trillions in financial products which reference it. [Link; auto-playing video]
CBOE plans to launch bitcoin futures, announces agreement with Winklevoss brothers’ digital currency exchange by Evelyn Cheng (CNBC)
As crypto-currencies gain prominence, derivatives based on them are coming to the US. Futures will be settled in cash, but it’s still a huge step forward for the space. [Link]
Social Media
Facebook Shuts Down AI System After Bots Create Language Humans Can’t Understand (Gadgets 360)
In a strange development, Facebook recently shut down one of its bot systems because various programs fueled by AI had created a new language to converse in. [Link]
This Is Probably The Only Story You Didn’t Hear About First From Bradd Jaffy And Kyle Griffin by Steven Perlberg and Charlie Warzel (Buzzfeed)
Background on two tweeters who have developed massive followings and some competition to be crowned the king of breaking news. [Link]
FANG
Driving Tesla’s Model 3 Changes Everything by Tom Randall (Bloomberg)
“Glowing” doesn’t quite capture the degree of enthusiasm in this review of the Model 3, which is now entering production; while ~$40k segment of the sedan market it’s targeting is crowded and seeing weak demand, the car sounds incredible to us. [Link; auto-playing video]
Netflix is on the hook for $20 billion. Can it keep spending its way to success? by David Ng (LAT)
With 104mm global subscribers (+25% YoY), demand for Netflix’s service has exploded. But the company has also levered up, creating the possibility that its popularity and content stable won’t be enough to fund debt it’s issued to make shows. [Link]
Sports
The Hungriest Man On Earth by Joon Lee (Bleacher Report)
A sad but ultimately positive story of the heaviest NFL player in the league’s history. [Link]
Escaping Kakuma by Louis Bien (SBNation)
Amidst the tents and shanties of the world’s largest refugee camp in northwest Kenya (which borders both Sudan and Somalia), soccer is an escape and a passion. [Link]
Humor
Millennials Unearth an Amazing Hack to Get Free TV: the Antenna by Ryan Knutson (WSJ)
An amusing survey of the recent trend of 20- and 30-somethings rediscovering the original means of television broadcast: the humble antenna. [Link; paywall]
An Honest Business News Update by Morgan Housel (Collaborative Fund)
Here’s what the news would read like if we were all being perfectly honest about what goes on at the top level in the world of finance and economics. [Link]
Science
Why We Can’t Have the Male Pill by Emily Anthes (Bloomberg)
Inside the long-running and thus far futile effort to develop a male birth control pill. [Link]
How ‘Bout Them Apples?
Good Will Hunting: An Oral History by Janelle Nanos (Boston Magazine)
A fun and informative romp through the making of the classic drama about human capacity, relationships, and community. [Link]
Dating
Austin Luxury High-Rise Tenants Swiped Left On Bumble’s Code-Violating HQ by Joseph Bernstein (Buzzfeed)
It turns out the neighbors get annoyed when you try to run your successful dating start-up out of a luxury apartment complex. [Link]
Have a great Sunday!
The Closer: End of Week Charts — 8/4/17
Looking for deeper insight on global markets and economics? In tonight’s Closer sent to Bespoke clients, we recap weekly price action in major asset classes, update economic surprise index data for major economies, chart the weekly Commitment of Traders report from the CFTC, and provide our normal nightly update on ETF performance, volume and price movers, and the Bespoke Market Timing Model. This week, we’ve added a section that helps break down momentum in developed market foreign exchange crosses.

The Closer is one of our most popular reports, and you can sign up for a free trial below to see it!
Click here to start your no-obligation two-week free Bespoke research trial now!