Europe On a Breakout
European equities are staging a bit of a breakout to start off the week, with the STOXX 600, a broad benchmark of European equity market performance, trading up just under 1% and back above its 50-DMA for the first time since late June. Today’s rally in the STOXX 600 is also notable due to the fact that the index is poised to break out above both its 200-DMA and 50-DMA on the same day. Looking at the chart below, the index has also broken its short-term downtrend that’s been in place ever since it last traded above the 50-DMA, and that could open the door for more short term gains. Looking at the chart below, it doesn’t look as though it has been a particularly good year for European equities, as the STOXX 600 is up just 4.9% on the year.

For US investors, however, the picture for European equities looks a lot rosier. The primary reason for this is the weak US Dollar, which has impacted the performance of various assets classes in a big way. We covered this topic in detail in last week’s Bespoke Report newsletter, so if you are not a subscriber, we strongly recommend that you take advantage of our special introductory $1 offer and check it out now! The chart below shows the performance of the STOXX 600 index, but instead of local currency terms, we show how performance would look when translated into dollars. In other words, for a US investor, how has performance looked? In this scenario, the STOXX 600 is not only not in a downtrend, but it is breaking out of a multi-week consolidation phase. Rather than being up just 4.9% YTD, in dollar-adjusted terms, the STOXX 600 is up close to 20%! Like just about everything else in life, when it comes to market returns, perspective is everything.

Sign up now and receive full access to any of Bespoke’s membership levels for just $1!
Bespoke Stock Seasonality — 9/11/17
Chart of the Day: Fully HEDJ’d
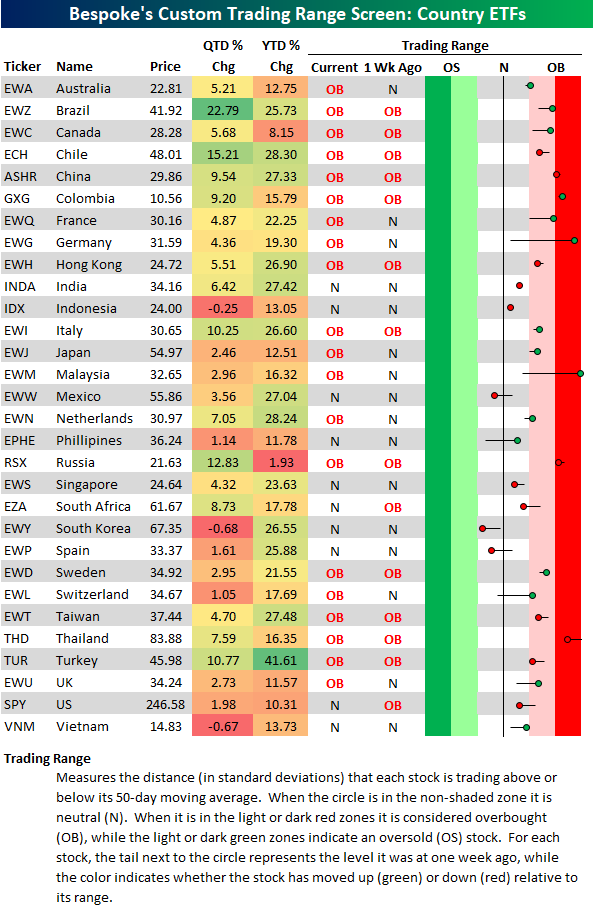
Bespoke’s Country Trading Range Screen — 9/11/17
Country ETFs that are traded on US exchanges are beginning the week mostly in overbought territory, with a few that are well extended into extreme territory. Of the 30 country ETFs in our trading range screen below, 20 are overbought while 10 are neutral and none are oversold. Germany (EWG) and Malaysia (EWM) are the most overbought countries — both are roughly 3 standard deviations above their 50-day moving averages. Only 3 countries are below their 50-day moving averages — Mexico (EWW), South Korea (EWY), and Spain (EWP). Also note that the US (SPY) is one of the ten country ETFs in neutral territory.
Gain access to any of Bespoke’s premium membership levels for just $1!
Bespoke Brunch Reads: 9/10/17
Welcome to Bespoke Brunch Reads — a linkfest of the favorite things we read over the past week. The links are mostly market related, but there are some other interesting subjects covered as well. We hope you enjoy the food for thought as a supplement to the research we provide you during the week.
See this week’s just-published Bespoke Report newsletter by starting a no-obligation two-week free trial to our premium research platform.
Investing
Investors Aren’t Putting Their Money Where Their Morals Are by Asjylyn Loder (WSJ)
While many investors express an interest in social responsible investments, asset flows have not been forthcoming for environmental, social, and governance-based investment themes. [Link; paywall]
Profit Margins, Bayes’ Theorem, and the Dangers of Overconfidence by Jesse Livermore (Philosophical Economics)
A statistical examination of a common trap that investors fall into, leaving them missing out on large equity market gains. [Link]
How The Other Side Lives
New York’s wealthy plagued by self-doubt by Simon Kuper (FT)
Interviews with 50 high income parents in New York City reveals a lingering guilt among those with high income, including masking their significant wealth. [Link; paywall]
Hookworm, a disease of extreme poverty, is thriving in the US south. Why? by Ed Pilkington (The Guardian)
Residents in Alabama have started testing positive for a disease that has no place in modern American society: hookworm, which thrives among areas of extreme poverty, often exacerbating the disadvantages facing its victims. [Link]
Labor Markets
Workers: Fear Not the Robot Apocalypse by Greg Ip (WSJ)
While the end of retail jobs get all the headlines, the benefits of more efficient business models get almost no credit; Ip explores them at length. [Link; paywall]
The Phillips Curve is Working Just Fine, Thanks by Michael Ashton (E-piphany)
While inflation hasn’t responded much to unemployment rate declines, wage growth still seems well-correlated to the tightening labor market on a lagged basis. [Link]
To Understand Rising Inequality, Consider the Janitors at Two Top Companies, Then and Now by Neil Irwin (NYT Upshot)
A study in contrasts between similarly compensated women both working as custodians at large tech companies; now, with little chance for advancement, and then, when the path to the C-suite was still open. [Link; soft paywall]
Public Policy
Trump Says ‘a Lot of Good Reasons’ to Get Rid of Debt Ceiling by Jennifer Epstein, Laura Litvan, and Ekik Wasson (Bloomberg)
In a rare bit of good news, there appears to be room for a deal between Congressional Democrats and the President over ditching the debt ceiling after a deal this week to extend the existing limit by 3 months. [Link; auto-playing video]
Free lunch announced for all students at all NYC public schools (WABC Eyewitness News)
Public schools in New York City will now provide free breakfast and lunch to every student, removing the stigma of free lunches based on means testing. [Link; auto-playing video]
Natural Disasters
How Irma Became Irma: A Monster Storm Six Months in the Making by Brian K Sullivan (Bloomberg)
The failure of an El Nino to arrive in the Pacific this year was one reason higher ocean temperatures and wet air swirled together to create a massive hurricane currently threatening Florida. [Link; auto-playing video]
The Role of Global Supply Chains in the Transmission of Shocks: Firm-Level Evidence from the 2011 Tōhoku Earthquake by Christoph E. Boehm, Aaron Flaaen, and Nitya Pandalai-Nayar (FEDS Notes)
An overview of economic impacts of disasters, using the 2011 Japanese earthquake which led to the Fukushima disaster as a model for impacts on US firms that had suppliers in Japan. [Link]
Scams
Dubai or bust for Baroness Bitcoin by Izabella Kaminska (FTAV)
A former model is running a bitcoin startup designed to facilitate the purchase of residential property in Dubai, and contrary to the stated benefits, the real attraction rhymes with “lax invasion”. [Link; registration required]
WFAN’s Craig Carton charged on Ponzi scheme, court papers say by John Riley (Newsday)
In the wild world of New York sports radio, perhaps it was just a matter of time before someone was charged with running a Ponzi scheme. [Link]
Three Equifax Managers Sold Stock Before Cyber Hack Revealed by Anders Melin (Bloomberg)
In the days before one of the US credit bureaus announced a hack impact 57% of US adults, several of its executives sold large blocks of stock in a manner that looks an awful lot like an effort to avoid declines stemming from the announcement. [Link; auto-playing video]
International Affairs
This Tiny Country Feeds the World by Frank Viviano (National Georgraphic)
Greenhouses in the tiny and land-lacking Netherlands are part of a system that produces radically higher crop yields with a fusion of biology, technology, and determination. [Link; soft paywall]
North Korea: Why the West freaks out but South Korea doesn’t by Robert E Kelly (Lowry Institute)
An excellent article detailing why non-Koreans are so much more worried about the North Korean situation than those who are most directly in its crosshairs. [Link]
Real Estate
NYC Landlords That Can’t Find Buyers Turn to Borrowing Instead by Sarah Mulholland (Bloomberg)
Unable to deliver unlevered returns with rent growth slowing, landlords are levering properties up to boost returns on equity. [Link]
Sports
Bomani Jones (Jeff Pearlman)
Jones’ former colleague and renowned sportswriter Jeff Pearlman interviews Bomani Jones. [Link]
Have a great Sunday!
S&P 500 Quick-View Chart Book — 9/8/17
The Bespoke Report — 9/8/17
The Closer: End of Week Charts — 9/8/17
Looking for deeper insight on global markets and economics? In tonight’s Closer sent to Bespoke clients, we recap weekly price action in major asset classes, update economic surprise index data for major economies, chart the weekly Commitment of Traders report from the CFTC, and provide our normal nightly update on ETF performance, volume and price movers, and the Bespoke Market Timing Model. This week, we’ve added a section that helps break down momentum in developed market foreign exchange crosses.

The Closer is one of our most popular reports, and you can sign up for a free trial below to see it!
Click here to start your no-obligation two-week free Bespoke research trial now!
4th-Longest S&P 500 Streak of Days Without A 5% Drawdown Continues
While the S&P 500 is a bit less than 1% from all-time highs and hasn’t made a new high in a month, the current drawdown is extremely small by historical standards. In the chart below, we show streaks of days where the benchmark index has avoided a decline from all-time highs of at least 5%. Each streak starts the day the index gets back within 5% of all-time highs after declining from them. During the current bull market, there have been a number of such declines, most recently around the Brexit vote in June of last year. Since then, however, the index hasn’t moved down more than 5% from record highs. That streak of 303 trading days and counting is the 4th-longest on record, matched only by streaks ending in 1965, 1994, and 1996. It’s worth noting that long streaks without large declines don’t necessarily result in huge gains; for instance, the 1994 streak saw a 14.2% gain. The 1965 streak lasted 4 months longer than the current one but only resulted in gains slightly better than the current streak’s 23.1% move higher.
Take advantage of our extended Labor Day Special, where you receive a month of full access to any of our research services for just $1 and then 20% off for the life of the subscription!
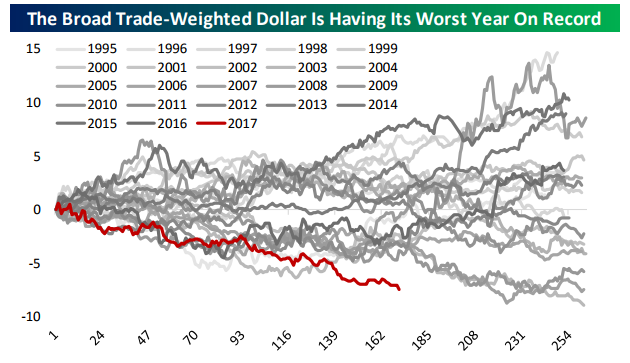
Worst Year for the Dollar Since 1986
Entering 2017, the USD had been up four years running on a broad trade-weighted basis with 8.6% gains in 2014, 10.7% appreciation in 2015 and a more modest 3.0% move in 2016. That last year was a less dramatic move but from May 2nd lows to the 15+ year peak on January 7th, the buck was up almost 9.3% or 14.5% at an annual pace.
Unfortunately for greenback bulls, things have gone wildly off-script since. The dollar has reversed its entire May 2016-January 2017 rally in a move that’s frankly shocked the FX world. As shown below, for the broad trade weight dollar this was the worst year on record through last Friday (latest data available) and the route has gotten worse this week with the Bloomberg USD Index (a decent proxy for the USD broad trade-weighted index) down a whopping 1.5% this week, its worst since the 5 days ending May 19th. Given that US economic data has actually held up quite well and there have been no radical policy shifts from the FOMC, that’s a pretty staggering move.
On a narrow major currency basis, the USD is just as weak. As shown below, this was the worst YTD through September 1st since 1986 (the year following the Plaza Accord agreement to devalue the USD) and the second-worst ever after this week’s decline, besting the 10% devaluation of the dollar engineered in 1973. Again, the contrast between the surging dollar post-election and the strong USD environment that prevailed for years before that event has been incredible: the dollar just won’t stop falling after it wouldn’t stop rising for years.
Take advantage of our Labor Day Special to see further analysis of the dollar’s decline, valuation, and investment implications.
