The Closer — S&P De-FAANGed, Labor Turnover, Exports Punish WTI — 11/8/17
Log-in here if you’re a member with access to the Closer.
Looking for deeper insight on markets? In tonight’s Closer sent to Bespoke Institutional clients, we take a look at how much the FAANG stocks (Facebook, Apple, Amazon, Netflix, and Alphabet) have impacted S&P 500 returns. We also take a look at labor market turnover and review the EIA petroleum market data released today.

The Closer is one of our most popular reports, and you can sign up for a free trial below to see it!
See today’s post-market Closer and everything else Bespoke publishes by starting a 14-day free trial to Bespoke Institutional today!
B.I.G. Tips – Post Election Recap
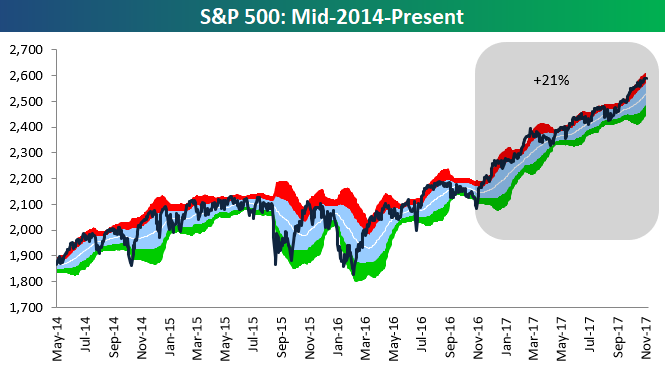
Time travel back to November 7th, 2016 — one day prior to the 2016 US Presidential Election. Which of these outcomes would you have thought more likely? 1) Trump wins the Election, or 2) the S&P 500 rallies 20%+ over the next year IF Trump wins the Election. We’ll let you ponder over that one for a moment, but fast-forward to today, and we’re now one year past Trump’s improbable victory on 11/8/16. Since then, the S&P 500 is up 21%.
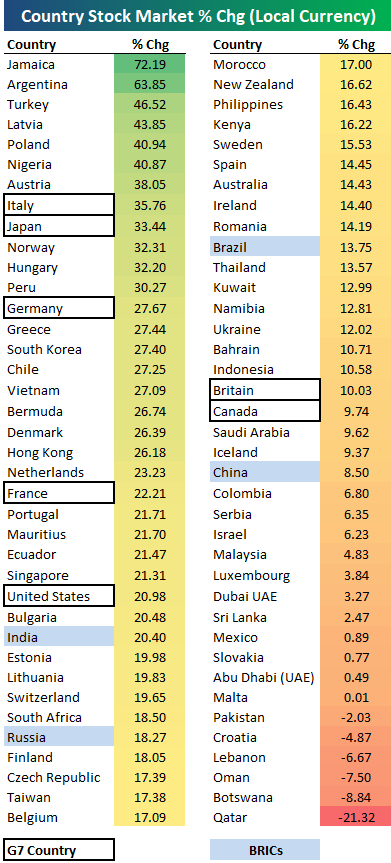
Below is a table highlighting the performance of 76 stock markets around the world since Election Day 2016 (in local currency). All but 6 of the 76 countries are up over the last year, with Jamaica on top at +72.19%. Of the G7 countries, Italy ranks first with a gain of 35.76%, followed by Japan at +33.44% and Germany at +27.67%. The US has been just the 5th best of the G7, with only Britain and Canada posting smaller gains. Of the BRICs, India is up the most while China is up the least
We’ve just published an in-depth report on the state of the market one year past Election Day 2016. If you would like to give it a read, start a 14-day free trial to Bespoke Premium now!
Fixed Income Weekly – 11/8/17
Searching for ways to better understand the fixed income space or looking for actionable ideals in this asset class? Bespoke’s Fixed Income Weekly provides an update on rates and credit every Wednesday. We start off with a fresh piece of analysis driven by what’s in the headlines or driving the market in a given week. We then provide charts of how US Treasury futures and rates are trading, before moving on to a summary of recent fixed income ETF performance, short-term interest rates including money market funds, and a trade idea. We summarize changes and recent developments for a variety of yield curves (UST, bund, Eurodollar, US breakeven inflation and Bespoke’s Global Yield Curve) before finishing with a review of recent UST yield curve changes, spread changes for major credit products and international bonds, and 1 year return profiles for a cross section of the fixed income world.
In this week’s note, we review ex-ante yields on crude oil futures, MLPs, and high yield bonds in the Energy sector.

Our Fixed Income Weekly helps investors stay on top of fixed income markets and gain new perspective on the developments in interest rates. You can sign up for a Bespoke research trial below to see this week’s report and everything else Bespoke publishes free for the next two weeks!
Click here and start a 14-day free trial to Bespoke Institutional to see our newest Fixed Income Weekly now!
Chart of the Day: Manufacturing Monster
Bespoke’s Global Macro Dashboard — 11/8/17
Bespoke’s Global Macro Dashboard is a high-level summary of 22 major economies from around the world. For each country, we provide charts of local equity market prices, relative performance versus global equities, price to earnings ratios, dividend yields, economic growth, unemployment, retail sales and industrial production growth, inflation, money supply, spot FX performance versus the dollar, policy rate, and ten year local government bond yield interest rates. The report is intended as a tool for both reference and idea generation. It’s clients’ first stop for basic background info on how a given economy is performing, and what issues are driving the narrative for that economy. The dashboard helps you get up to speed on and keep track of the basics for the most important economies around the world, informing starting points for further research and risk management. It’s published weekly every Wednesday at the Bespoke Institutional membership level.
You can access our Global Macro Dashboard by starting a 14-day free trial to Bespoke Institutional now!

The Closer — Phenomenal Factor, JOLTS Journey, Consumptive Credit — 11/7/17
Log-in here if you’re a member with access to the Closer.
Looking for deeper insight on markets? In tonight’s Closer sent to Bespoke Institutional clients, we take a look at quantitative factor performance in the US equity market, data from the monthly JOLTS report, and a recap of consumer credit numbers from the Fed.
The Closer is one of our most popular reports, and you can sign up for a free trial below to see it!
See today’s post-market Closer and everything else Bespoke publishes by starting a 14-day free trial to Bespoke Institutional today!
ETF Trends: Fixed Income, Currencies, and Commodities – 11/7/17
Bespoke’s Global Stock Market Trading Range Screen
Below is an updated look at our global stock market trading range screen using 30 of the largest country ETFs traded on US exchanges. For each country, the dot represents where it’s currently trading, while the tail end shows where it was trading one week ago. The black vertical “N” line represents each country’s 50-day moving average, and moves into the red or green zones are considered “overbought” or “oversold.”
While it seems like markets have been doing nothing but go up lately, there’s actually been quite a bit of movement in both directions recently. Of the 30 ETFs in our screen, 10 are currently overbought while 5 are oversold. Brazil (EWZ) and Spain (EWP) are examples of countries that have moved lower down into oversold territory over the last week.
Even still, the average country ETF in our screen is still up more than 20% on a year-to-date basis. Quarter-to-date, the average country ETF is up just over 1%. Brazil, Colombia, and Mexico have done the worst this quarter, while China, India, Japan, South Korea, and Vietnam have done the best.
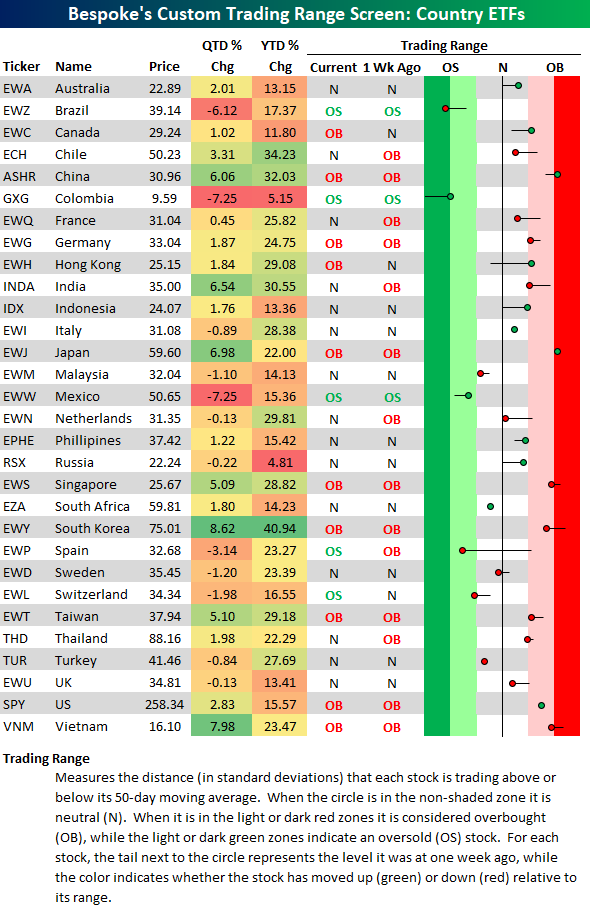
Chart of the Day: Dollar & Energy In Step
Longest Overbought Streak For S&P 500 Since 2012
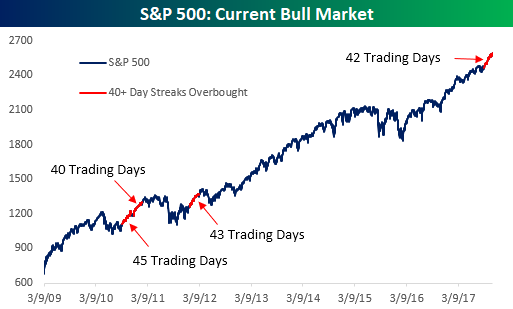
It’s been quite a run for the S&P 500 over the last several weeks, and the chart below illustrates just how consistent the equity market’s strength has been. The chart comes from the second page of our daily Morning Lineup report, which is available to all Bespoke Premium and Institutional clients. In it, we show the S&P 500’s daily close relative to its 50-day moving average (DMA) where overbought levels are considered to be readings where the S&P 500 closes one or more standard deviations above its 50-DMA, while oversold levels are readings where the S&P 500 closes one or more standard deviations below its 50-DMA. As shown in the chart, ever since September, a period now covering 42 trading days, the S&P 500 has closed at either an overbought or extreme overbought level.

Looking at the chart, the current streak of overbought closes is easily the longest of the last year, but looking further back at the current bull market, there have only been three other periods where the S&P 500 closed at overbought levels for 40 or more trading days. The chart below shows the S&P 500 through the course of the entire bull market dating back to March 2009. As shown, two of those prior streaks occurred within ten trading days of each other when a 45 trading day streak ended on 11/12/10 and another one began on 12/1/00. Besides those two streaks, the only other streak of 40 or more trading days was back in early 2012 when a 43 trading day streak came to an end in March 2012. Finally, while it may be hard to see on the chart, in both the one and six months that followed these prior streaks coming to an end, the S&P 500 was up all three times. Three months later the S&P 500 was up two out of three times with the one down period coming after the March 2012 streak when we saw a decline of 5.8%.