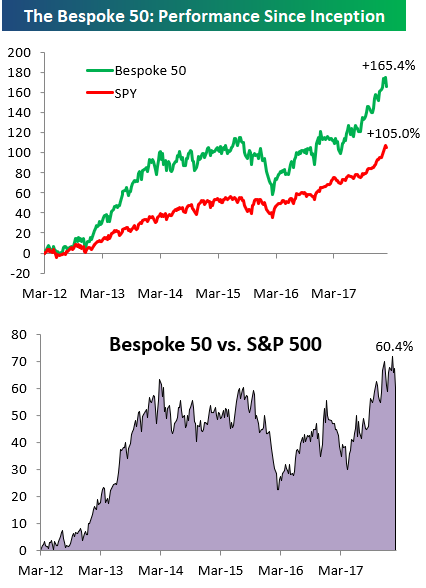
the Bespoke 50 — 2/1/18
Every Thursday, Bespoke publishes its “Bespoke 50” list of top growth stocks in the Russell 3,000. Our “Bespoke 50” portfolio is made up of the 50 stocks that fit a proprietary growth screen that we created a number of years ago. Since inception in early 2012, the “Bespoke 50” has beaten the S&P 500 by 60.4 percentage points. Through today, the “Bespoke 50” is up 165.4% since inception versus the S&P 500’s gain of 105.0%. Always remember, though, that past performance is no guarantee of future returns.
To view our “Bespoke 50” list of top growth stocks, click the button below and start a trial to either Bespoke Premium or Bespoke Institutional.
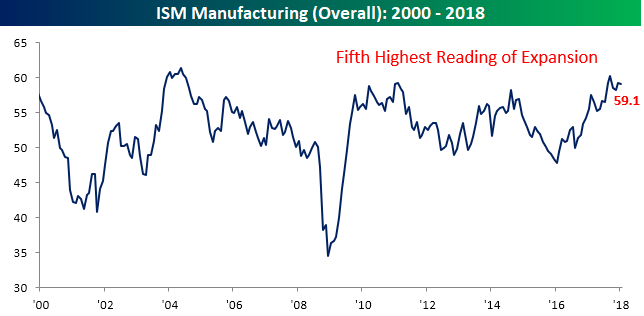
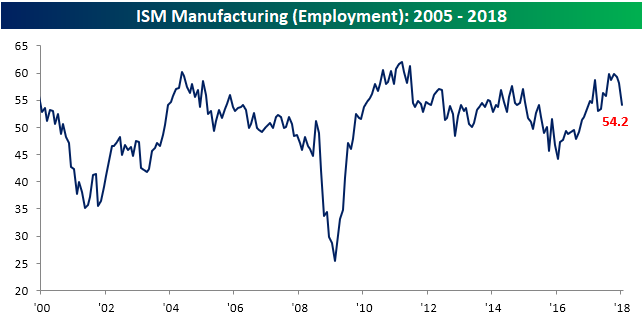
ISM Manufacturing Kicks off January Data on a Positive Note
Manufacturing activity in the US appears to have kicked off the year on a positive note as the ISM Manufacturing report for January saw a slight decline but came in higher than expected. While economists were forecasting a headline print of 58.6, the actual reading came in at 59.1 compared to December’s reading of 59.3. Despite the decline, it was still the fifth highest monthly print of the current expansion.
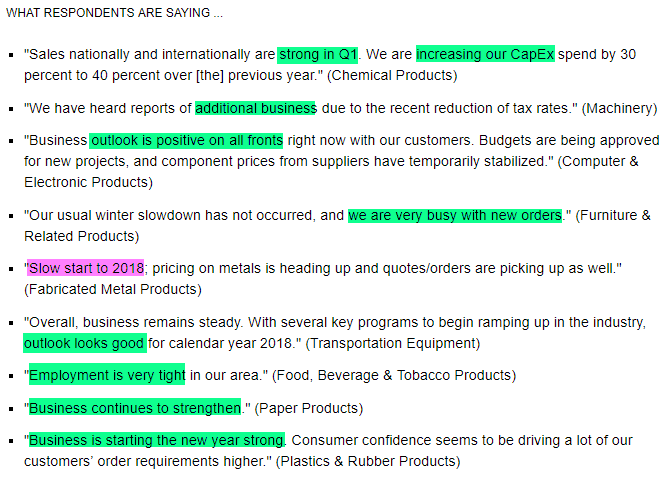
Commentary from respondents was also positive this month. Outside of the Fabricated Metals sector, manufacturers are seeing strong levels of business to start 2018.
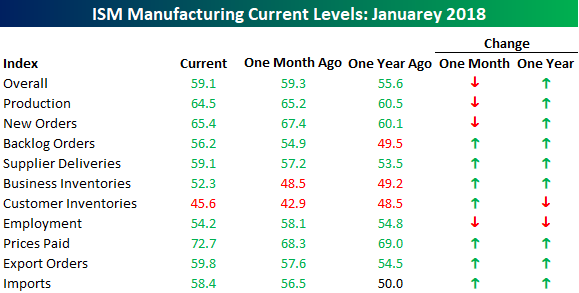
The table below breaks down this month’s report by each of the index’s subcomponents relative to last month and last year. Over both time frames, breadth in the report was strong. On a m/m basis, just three of ten subcomponents declined (Production, New Orders, and Employment- chart below), while on y/y basis, Customer Inventories and Employment were the only decliners. On the upside, Prices Paid saw a pretty big increase this month rising to its highest level since May 2011.

Sluggish Truck Sales From Ford
As regular readers are aware, we pay a lot of attention to monthly truck sales. Trucks are not only higher margin, but they are often purchased by small businesses and contractors so they provide a good read on the health of the small business sector. Based on these sales totals for January, small businesses are still expanding, but the pace of sales growth in January slowed after a Monster December. For the month of January, total truck sales came in at 58,937. While that’s a strong number relative to history (5th strongest since 1996), on a y/y basis it represents an increase of only 1.6% even though this past January had one extra selling day compared to January 2017. It’s hard to complain when sales are so close to the high end of their historical range, but it’s something investors have come to expect.

Individual Investors A Bit Less Confident
For all the talk about a supposed correction in the last few days, you wouldn’t know it from the chart of the S&P 500 and bullish sentiment below. If you squint real close, you can see something resembling a small decline for the S&P 500 (red line), but it’s negligible at best. That hasn’t stopped individual investors in the weekly AAII survey from becoming a little bit more cautious, though. In this week’s survey, bullish sentiment declined from 45.5% down to 44.8%. That’s the third weekly decline in the last four weeks, and during that time the bullish ranks have thinned by 15 percentage points. We’ve commented in the past several days that because markets have seen such a steady climb upward, even small declines in equity prices may spook investors and you could argue that the weekly sentiment numbers from AAII are showing just that.

Bearish sentiment, meanwhile, has been moving in the opposite direction. This week’s survey showed an increase in pessimism of nearly five percentage points as bearish sentiment increased from 24.0% up to 28.8%. In the last four weeks, bearish sentiment has now nearly doubled from its second lowest reading of the bull market back in early January.

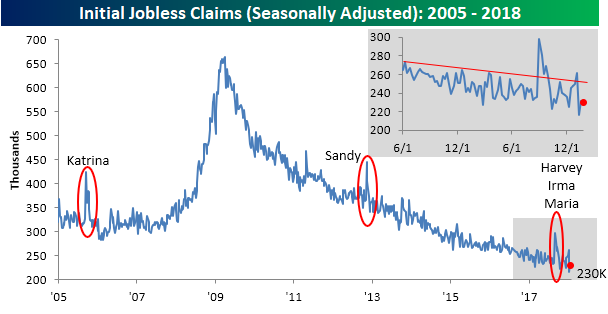
Jobless Claims Drop to 230K
Jobless claims were lower than expected this week and continue to hang around near their lowest levels in decades. While economists were expecting claims to rise from 231K up to 235K, they actually fell slightly to 230K. Throughout the entire economic expansion, jobless claims have only been lower in five different weeks. Furthermore, claims have now been below 300K for 152 straight weeks. If they stay below that level for another ten weeks, it will represent the longest streak of sub-300K readings on record (going back to the late 1960s), and this doesn’t even take population growth into account!
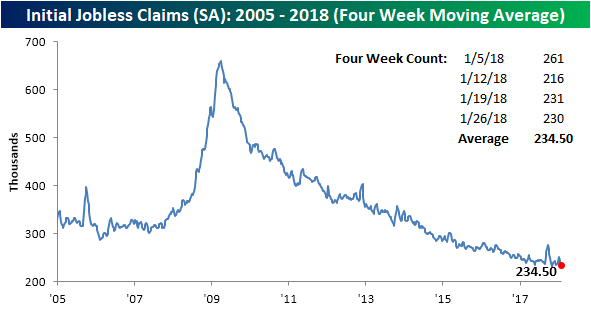
The four-week moving average for jobless claims also declined this week, falling from 239.5K down to 234.5K. That puts this reading within 3.5K of the multi-decade low of 231.25K from early November. Next week, the four-week moving average will drop a reading of 261K from the count, so barring a big increase in claims, we should see this reading make a new cycle-low next week.
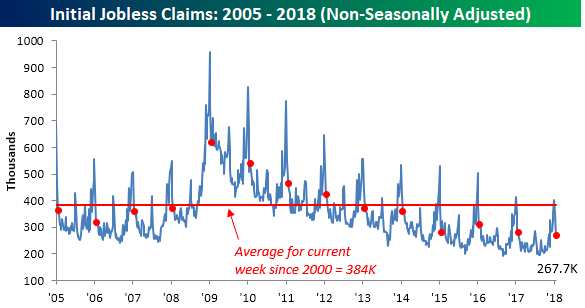
On a non-seasonally adjusted (NSA) basis, jobless claims were just as positive. This week’s level of 267.7K is more than 115K below the average reading for the current week of the year dating back to 2000. To find the same week of the year where NSA claims were lower, you have to go all the way back to 1973.
The Closer — Fed Hold, ECI Acceleration, EIA Data — 1/31/18
Log-in here if you’re a member with access to the Closer.
Looking for deeper insight on markets? In tonight’s Closer sent to Bespoke Institutional clients, we review the FOMC’s policy decision today, update our tracking of wage growth as indicated by the BLS’s employment cost index, and finally recap weekly petroleum market data and energy market price action.

See today’s post-market Closer and everything else Bespoke publishes by starting a 14-day free trial to Bespoke Institutional today!
Record Streak Without a 3%+ Pullback
On Monday the S&P 500 broke a streak of 99 trading days without a 0.60%+ decline. Then yesterday the index broke a streak of 310 trading days without back-to-back declines of 0.50%+ or more.
One streak that is still going, however, is the record length of days it has been without a 3% pullback. It has now been 448 calendar days since the S&P 500 last fell 3% from a closing high.
Below is a chart showing streaks without a 3%+ pullback for the S&P 500 throughout its entire history. Late last year we broke the prior record of 370 days set back in 1995, and since then the S&P hasn’t looked back.
We might be getting close, though. Since last Friday’s high, the S&P is now down 1.7%.
Streaks are made to be broken, and this one will eventually be broken as well. It’s been quite the ride!
