Chart of the Day: ISM Commodities Survey Pauses
Bespoke’s Most Volatile Stocks on Earnings: April 2018 Edition
The first quarter earnings season begins today. With the stock market struggling lately, there seem to be a lot of bulls hanging their hopes on earnings strength to help pull the market out of correction territory.
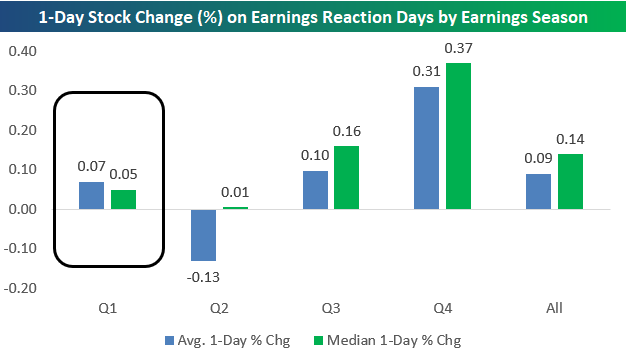
From a seasonal perspective, stocks don’t typically react all that great to their first quarter earnings reports. Using our Earnings Screener tool, we can see how stocks typically react to earnings reports by quarter. Historically, the average stock has gained 0.07% on its earnings reaction day during the first quarter earnings season. That’s the second worst quarter behind only the second quarter reporting period. The best earnings season for stock prices is Q4, when the average stock gains 0.31% on its earnings reaction day. This held true last season when the average stock gained 0.45%.
(For a stock that reports in the morning before the open, its earnings reaction day is that trading day. For a stock that reports after the close, its earnings reaction day is the next trading day.)
Start a free trial to Bespoke Institutional to begin using our Earnings Screener now.
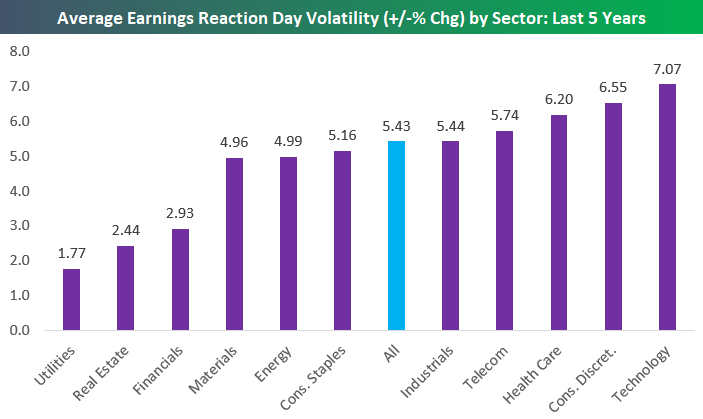
Over the last five years, the average stock that has reported earnings has gained or lost 5.43% on its earnings reaction day. That’s a huge move for investors to deal with once every three months.
Below we have broken out the average daily move for stocks reporting earnings by sector. As expected, Utilities stocks experience the least amount of volatility in reaction to their earnings reports. Notably, though, Financial stocks are the third least volatile in reaction to earnings with an average one-day move of +/-2.93%. The remaining sectors all experience average moves of roughly +/-5% or more.
At the high end of the list is Technology. As shown, the average Tech stock moves +/-7.07% on its earnings reaction day. Consumer Discretionary stocks are the second most volatile to earnings with an average absolute move of 6.55%. Health Care ranks third at +/-6.2%, followed by Telecom and Industrials.
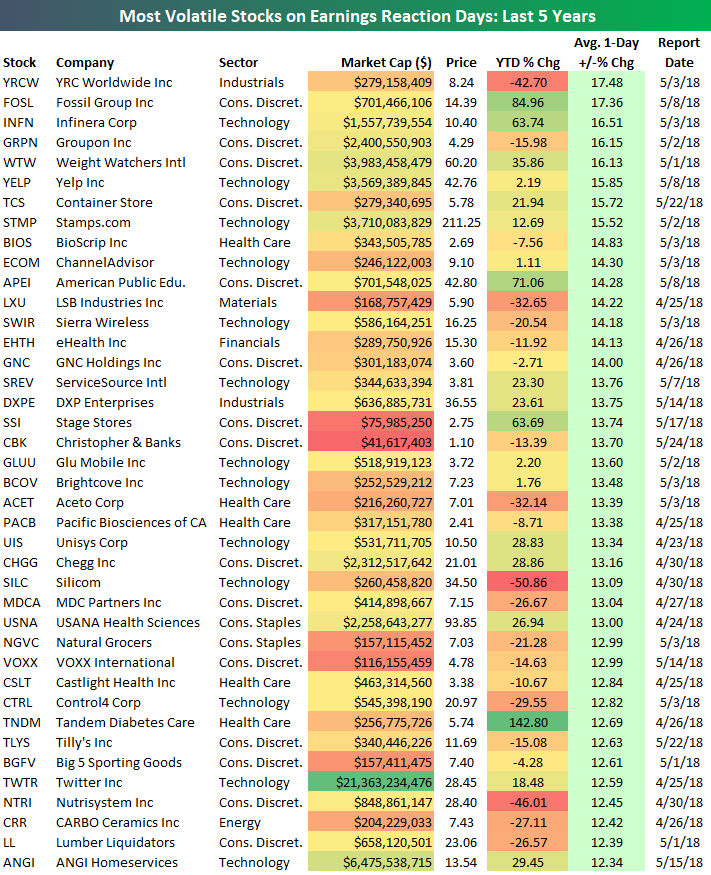
As we do ahead of each earnings season, below is a list of the most volatile stocks on earnings over the last 5 years (last 20 earnings reports). To make the list, a stock needs to have at least 4 years (16 earnings reports) worth of earnings, and it must be set to report its next quarterly number between now and the end of May.
As shown, YRC Worldwide (YRCW) is the most volatile stock on earnings with an average move of +/-17.48% on its earnings reaction day. Fossil Group (FOSL) ranks second just behind YRCW at +/-17.36%. Three more stocks have averaged moves of more than 16% on their earnings reaction days — Infinera (INFN), Groupon (GRPN), and Weight Watchers (WTW).
Other notables on the list of most volatile stocks on earnings include Yelp (YELP), GNC Holdings (GNC), Twitter (TWTR), and Nutrisystem (NTRI).
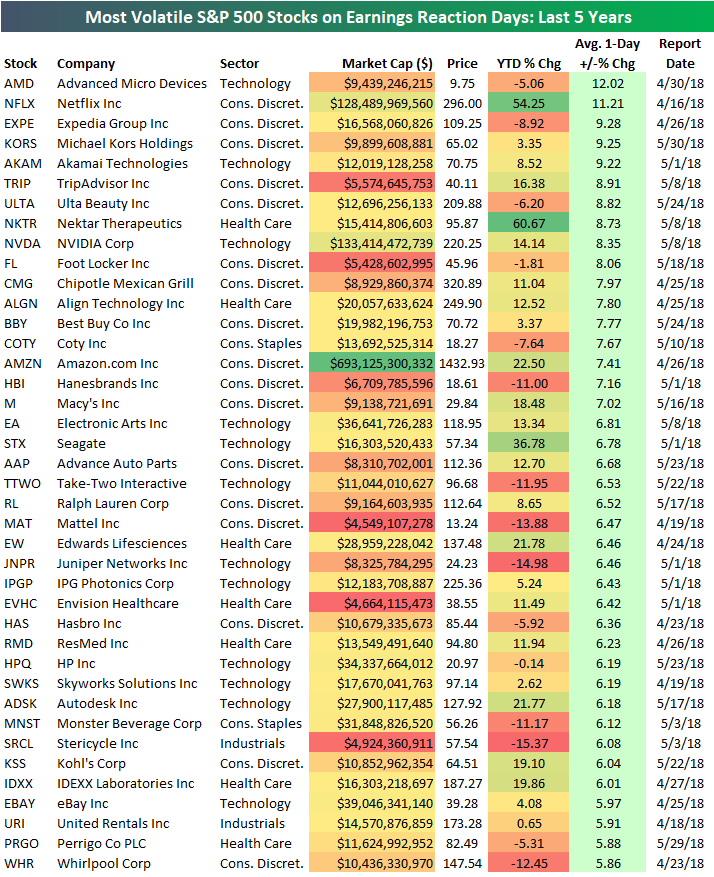
Not one S&P 500 stock made the list of the top 40 most volatile stocks on earnings, so below we show the 40 most volatile S&P 500 stocks on earnings.
Advanced Micro Devices (AMD) ranks first with an average move of +/-12.02% on its earnings reaction days over the last 5 years. Netflix (NFLX) ranks second with an average move of +/-11.21%. AMD and NFLX are the only two S&P 500 stocks that typically experience moves of 10% or more on earnings.
Expedia (EXPE), Michael Kors (KORS), and Akamai (AKAM) round out the top five. Other notables on the list include NVIDIA (NVDA), Chipotle (CMG), Best Buy (BBY), Amazon.com (AMZN), Electronic Arts (EA), and eBay (EBAY).
Analysts Retreat
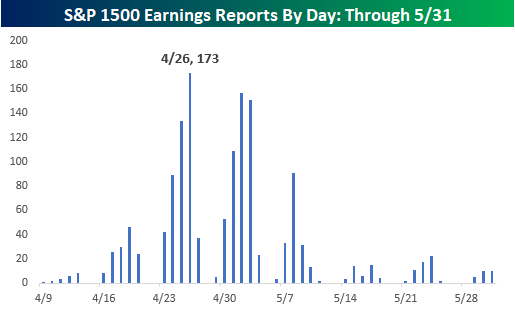
Earnings season kicks off this week as the first of the major companies start to report Q1 numbers. Most of the big names reporting are Financials like Blackrock (BLK) on Thursday after the close, and then Citigroup (C), JP Morgan (JPM), PNC, and Wells Fargo (WFC) on Friday morning. Besides these names, the only non-Financials of note are Bed Bath & Beyond (BBBY) on Wednesday and Delta (DAL) and Rite Aid (RAD) on Thursday.
The pace of reports will pick up next week when 134 companies in the S&P 1500 are expected to report, but the peak period of earnings season will be over the following two weeks when more than 450 companies are scheduled to report each week. The busiest day during that period will be on 4/26 when 173 companies in the S&P 500 are expected to report in a single day! For a more detailed rundown of the earnings schedule for the upcoming season, please see our Interactive Earnings Calendar, and to prepare for how individual companies you follow tend to react to earnings, make sure to check out our Earnings Screener (available to all Institutional clients).
We just published our quarterly look at analyst EPS revisions heading into this earnings season. In this report, we look to see if analysts are bullish or bearish on earnings for the upcoming quarter. Analyst sentiment at the start of earnings season has historically had a big impact on the stock market’s performance.
This report is a must-read. To see it, sign up for a Bespoke Premium membership now!
Bespoke Brunch Reads: 4/8 /18
Welcome to Bespoke Brunch Reads — a linkfest of the favorite things we read over the past week. The links are mostly market related, but there are some other interesting subjects covered as well. We hope you enjoy the food for thought as a supplement to the research we provide you during the week.
Labor Market
Target Agrees to Review Screening of Job Applicants Amid Claims of Bias by Colin Moynihan (NYT)
Amidst a tight labor market, Target is showing a willingness to loosen its policy of conducting background checks dating back 10 years or more and refusing to hire candidates with infractions as light as misdemeanors. [Link; soft paywall]
Teacher Strikes Are Spreading Across America With No End in Sight by Josh Eidelson (Bloomberg)
Amidst stagnant pay and benefits, teachers in at least three states are demanding more pay. The paucity of strikes in recent years makes these work actions all the more interesting. [Link; auto-playing video]
Bob Davis Stories
The Architect of Trump’s Threatened China Trade War by Bob Davis (WSJ)
A profile of US Trade Representative Bob Lighthizer, the attorney and long-experienced trade negotiator who is forging the Trump Administration’s escalating protectionist policy. [Link; paywall]
The Future of America’s Economy Looks a Lot Like Elkhart, Indiana by Bob Davis (WSJ)
Rising house prices, signing bonuses in fast food, booming truck sales, and workers skipping college to assemble RVs are all characteristics of the boom in Elkhart, where unemployment has gone from 20% to 2% and worker shortages are forcing wide-ranging recruitment efforts. [Link; paywall]
Investing
Yale Endowment’s Casting Call Says ‘All Inquiries Are Welcome!’ by Janet Lorin (Bloomberg)
Yale’s legendary endowment office has an open door policy, inviting pitches from all manner of investors. [Link; auto-playing video]
Wall Street’s Big Banks Are Waging an All-Out Technological Arms Race by Hugh Son and Dakin Campbell (Bloomberg)
The story of electronic equities trading’s rise, which fueled a big payoff in the post-crisis world of a more algorithmic environment for big buyers and sellers of stock. [Link]
Pop Culture
‘We Played Prince Before Anyone Else’: How A Small Radio Station Changed American Pop Music by Zach Schonfeld (Newsweek)
Long Island radio station WLIR helped fuel the rise of new wave rock, helping forge a middle path between punk and disco. [Link]
Joaquin Phoenix by Will Farrell (Interview Magazine)
A free form phone interview of the eccentric actor by a comedic legend is just as fun, insightful, and revealing as you might expect, with a healthy dose of hilarious banter and anecdotes making the whole thing a really fun read. [Link]
Life, Online
Max Schrems: the man who took on Facebook – and won by Hannah Kuchler (FT)
A profile of the man that brought the fight over privacy to the social media giant, long before headlines about election influence, Cambridge Analytica, or concerned interviews by Mark Zuckerberg. [Link; paywall]
The joys of online syntax by Marie Le Conte (Chatham House)
An investigation of the trials and tribulations of communicating in short bits and bytes that lack context and even have a language entirely their own. [Link]
Real Estate
Manhattan Home Sales Tumble Most Since 2009 as Buyers Walk by Oshrat Carmiel (Bloomberg)
A small buyer’s strike is emerging in Manhattan real estate markets, where tax deduction limitations and higher borrowing costs have crimped activity. [Link; auto-playing video]
Injustice
A Betrayal by Hannah Dreier (ProPublica)
After risking his life to work with authorities in the fight against MS-13 and turning away from the violence of that gang, a young man was rewarded with deportation back to a country where he will be murdered for his heroism. [Link]
Read Bespoke’s most actionable market research by starting a two-week free trial today! Get started here.
Have a great Sunday!
The Bespoke Report — 4/6/18
The Closer: End of Week Charts — 4/6/18
Looking for deeper insight on global markets and economics? In tonight’s Closer sent to Bespoke clients, we recap weekly price action in major asset classes, update economic surprise index data for major economies, chart the weekly Commitment of Traders report from the CFTC, and provide our normal nightly update on ETF performance, volume and price movers, and the Bespoke Market Timing Model. We’ve recently added a section that helps break down momentum in developed market foreign exchange crosses as well.
Below is a snapshot from today’s Closer highlighting weekly intraday price charts for major equity indices and other asset classes. If you’d like to see more, start a free trial below.

The Closer is one of our most popular reports, and you can sign up for a free trial below to see it!
See tonight’s Closer by starting a two-week free trial to Bespoke Institutional now!
Offbeat Economic Indicators — Cosmetic/Plastic Surgery, Living Paycheck to Paycheck
Each month, Bespoke runs a survey of 1,500 US consumers balanced to census. In the survey, we cover everything you can think of regarding the economy, personal finances, and consumer spending habits. We’ve now been running the monthly survey for more than three years, so we have historical trend data that is extremely valuable, and it only gets more valuable as time passes. All of this data gets packaged into our monthly Bespoke Consumer Pulse Report, which is included as part of our Pulse subscription package that is available for either $39/month or $365/year. We highly recommend trying out the service, as it includes access to model portfolios and additional consumer reports as well. If you’re not yet a Pulse member, click here to start a 30-day free trial now!
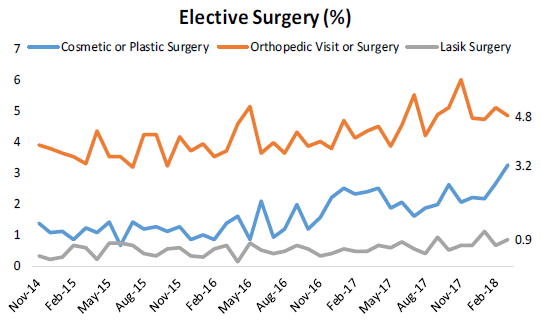
We ask questions in our monthly Pulse survey that ultimately provide us with directional trends for the US economy. With multiple years of survey data at this point, we now have a number of “bespoke” economic indicators. Some of the indicators are more traditional (unemployment, spending, income, etc.), while others are off the beaten path. Two “offbeat” economic indicators that we now have from our monthly Pulse survey are shown below. The first shows the percentage of consumers that have had elective surgery over the last month.
The thinking behind our “elective surgery” indicator is that consumers are willing to have more of these types of procedures when they’re feeling flush. When times are tough, elective procedures are out of the question.
As shown below, the percentage of consumers opting for cosmetic or plastic surgery hit a new high in our series in the most recent month, jumping up to 3.2%. That’s a healthy sign. Orthopedic visits or surgeries have been trending higher over the last few years as well, as has Lasik surgery. The cosmetic or plastic surgery indicator has definitely jumped the most of the three, though.
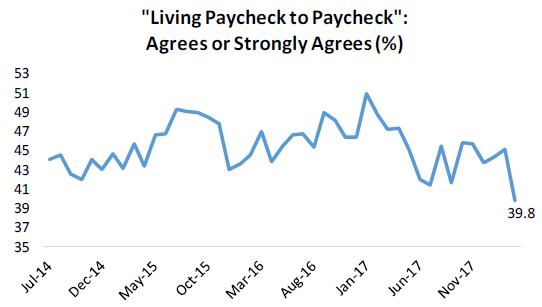
Another “offbeat” indicator we’ve built is the “living paycheck to paycheck” reading. Below are the historical results from our monthly survey question asking consumers if they consider themselves to currently be living paycheck to paycheck. As shown, those who agree or strongly agree that they do live paycheck to paycheck has been trending lower since early 2017, and it just hit a multi-year low in our series. This is another sign that the consumer is feeling pretty flush right now.
To access our full Pulse report, click here to start a 30-day free trial now!
The Closer — State LEIs, Trade Flop, Unemployment To Fall, EM Breakouts — 4/5/18
Log-in here if you’re a member with access to the Closer.
Looking for deeper insight on markets? In tonight’s Closer sent to Bespoke Institutional clients, we review the updated state level leading indicator data released today, along with US trade balance figures from the US Census, evidence of a strong print ahead for the unemployment rate, and the potential for breakouts versus the S&P 500 for a range of emerging market equity ETFs.

See today’s post-market Closer and everything else Bespoke publishes by starting a 14-day free trial to Bespoke Institutional today!
Chart of the Day: Drawdowns
Bespoke’s Sector Snapshot — 4/5/18
We’ve just released our weekly Sector Snapshot report (see a sample here) for Bespoke Premium and Bespoke Institutional members. Please log-in here to view the report if you’re already a member. If you’re not yet a subscriber and would like to see the report, please start a two-week free trial to Bespoke Premium now.
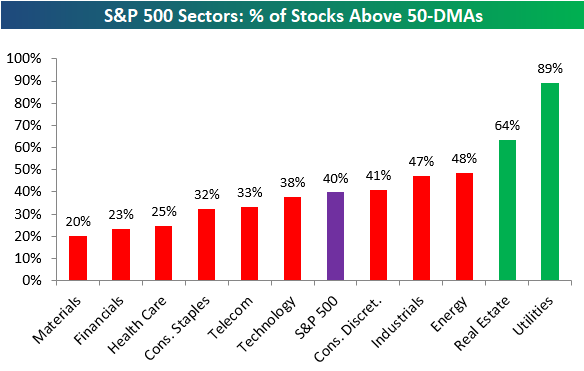
Below is one of the many charts included in this week’s Sector Snapshot, which highlights the percentage of stocks in S&P 500 sectors currently trading above their 50-day moving averages. As shown, just two sectors have breadth readings above the 50% mark, and they’re both defensive areas of the market (Utilities and REITS).
To find out what this means and to see our full Sector Snapshot with additional commentary plus six pages of charts that include analysis of valuations, breadth, technicals, and relative strength, start a two-week free trial to our Bespoke Premium package now. Here’s a breakdown of the products you’ll receive.