The Closer — You Down With GDD? — 5/14/18
Log-in here if you’re a member with access to the Closer.
Looking for deeper insight on markets? In tonight’s Closer sent to Bespoke Institutional clients, we review a new international debt dataset released by the IMF.

See today’s post-market Closer and everything else Bespoke publishes by starting a 14-day free trial to Bespoke Institutional today!
Eight Makes it Great
While the DJIA wasn’t quite able to hang on to its highs from earlier in the day, it still managed to finish the day higher on Monday, extending its streak of daily gains to eight. That’s right, the Dow hasn’t had a one-day decline since May 2nd! The table and chart below highlight each of the DJIA’s winning streaks of eight or more trading days since the prior bear market lows in March 2009. As the chart illustrates, during the first two years of the bull market there were three such streaks. Then, in the five-year stretch from March 2011 through March 2016, there was only one streak of eight or more days. In the last two years, though, the pace of streaks has picked up again with five.
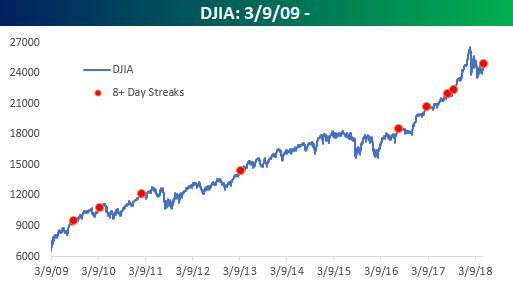
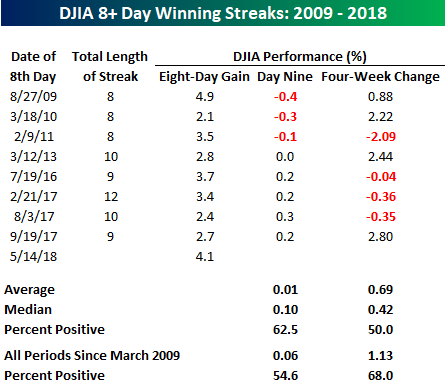
In the table below, we have listed the date of the 8th straight up day during each of the prior streaks along with the total number of days the streak lasted, the Dow’s performance during the first eight days, as well as its performance on day nine and over the next four weeks. Interestingly, based on the eight prior periods, the DJIA has a better than average chance of extending the streak to nine days and has been higher on the day after each of the last five eight-day streaks. Over the next four weeks, the average (0.69%) and median (0.42%) returns are also positive, but in this case, it really is a coin flip as to whether the Dow rises or falls with four-periods of gains and four of losses.
B.I.G. Tips – Analyst Sentiment by Market Cap, Sector
Chart of the Day: Analysts Like What They Hear
Consumer Staples An Epic Underperformer
Within the broader equity market these days, there probably isn’t a sector that is more out of favor than Consumer Staples. As consumers have shifted their tastes away from brands that dominated the economy of their parent’s generation, the stocks in the sector have been big market laggards. The chart below shows the relative strength of the Consumer Staples sector versus the S&P 500 since 1980. A rising line indicates outperformance on the part of the Consumer Staples sector, while a falling line indicates underperformance. After dominating the market in the 1980s, Consumer Staples performed inline with the market throughout most of the 1990s until the Tech bubble where they fell out of bed on a relative basis. By March 2000, there wasn’t a lonelier place to be in the market than Consumer Staples.
When the dot-com bubble burst, though, Consumer Staples saw a major rebound relative to the market and quickly regained all of the ground it lost during the late 1990s. Suddenly, stocks like Procter & Gamble (PG), Coca-Cola (KO), and Pepsi (PEP) that no one cared about a couple of years earlier were the new market darlings. Then in the bull market that followed, the sector fell out of favor again until the Financial crisis as investors shifted their focus to more growth-oriented names. Throughout the current expansion, Consumer Staples once again slowly lost ground relative to the market as investors started to drift away from defensive sectors.
In the last two years, the pace of underperformance has really started to accelerate, causing the sector’s relative strength to fall to an 11-year low versus the S&P 500. Once again, P&G and stocks like it are as popular as snow in April. How unpopular is the sector? Even after the sharp drop in relative strength, one major Wall St. firm just downgraded Consumer Staples to underweight!

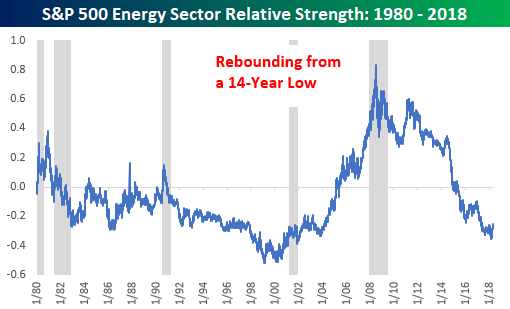
In terms of relative strength, one sector that is just starting to emerge from years of underperformance is Energy. The sector has seen a big rally over the last few months and is currently less than 3% from a 52-week high. Looking at the sector’s relative performance versus the S&P 500, though, you wouldn’t know it as you can barely see the turn higher.
Bespoke Brunch Reads: 5/13/18
Welcome to Bespoke Brunch Reads — a linkfest of the favorite things we read over the past week. The links are mostly market related, but there are some other interesting subjects covered as well. We hope you enjoy the food for thought as a supplement to the research we provide you during the week.
Auto Updates
Mercedes Wants to Borrow Money From You. Should You Bite? by Jason Zweig (WSJ)
Mercedes-Benz USA is appealing to customers to borrow, offering short-term notes (which are redeemable) to finance auto loan securitization and diversify funding sources. [Link]
Who’s Winning the Self-Driving Car Race? by David Welch and Elisabeth Behrmann (Bloomberg)
A very helpful summary of the various players and their progress on the effort to bring a totally self-driving car to market. While many companies have made big strides, nobody is even close to a full-blown “Level 5” vehicle (one without a steering wheel). [Link; soft paywall]
AI
Grimes, Elon Musk, and the Supposedly Trauma-Inducing A.I. Theory That Brought Them Together by Alexandra Ossola (Futurism)
Elon Musk and Grimes were apparently brought together by an allegedly horrifying but intellectually interesting scenario called Roco’s Basilisk (background from Slate here). The long and the short of it: don’t ever think about Roco’s Basilisk, or you may live to regret it. [Link]
Google Duplex: An AI System for Accomplishing Real-World Tasks Over the Phone by Yaniv Leviathan (Google AI Blog)
Natural language processing has evolved to the point that Google’s new Duplex system can place natural-sounding calls. Indeed, the calls are so natural sounding that they are indistinguishable from a human being. [Link]
Media
IAB says online advertising grew to $88B last year — more spending than TV by Anthony Ha (TechCrunch)
Online advertising has now surpassed TV ad spend, totaling $88bn in 2017 with an increase of more than 20% over 2016. Mobile add spending is more than half of the total. [Link]
Subscription hell by Danny Crichton (TechCrunch)
Media costs are rising sharply, content is fleeing behind paywalls which add up to unsustainable costs, and the whole space seems unsustainable per Crichton’s analysis. [Link]
Malfeasance
Undercover Cops Busted a Large Lego Crime Ring in Portland by Daniel Oberhaus (Motherboard)
A “fence” for stolen Lego has been busted in Portland, with tens of thousands of dollars’ worth of the toy seized as part of a massive crackdown. [Link]
Tidal Accused Of Deliberately Faking Kanye West And Beyoncé Streaming Numbers by Dagens Næringsliv (Music Business Worldwide)
Streaming numbers for recent major releases seem totally unrealistic, including a claim that the most recent Kanye West album was played 8 times per day on average by all of Tidal’s users. [Link]
Equifax’s Statement For The Record Regarding The Extent Of The Cybersecurity Incident Announced On September 7, 2017 (SEC)
Equifax discloses specifics on the absolutely staggering number of consumers whose personal information was exposed in a breach last year. [Link]
Chinese students in Canada are being conned into filming fake hostage videos by Ian Young (Inkstone)
Scammers in China are convincing students to unwittingly aid the extortion of their families by filming fake hostage videos. [Link]
Long Reads
The Weird, Dangerous, Isolated Life of the Saturation Diver by Jen Banbury (Atlas Obscura)
An amazing dive into the world of saturation divers, who live under high pressure for weeks at a time in order to more efficiently dive to work on the sea bed. [Link]
You can always count on an airport bar by Jen Doll (The Week)
An ode to the wonders – and yes, they are wonders – of the airport bar, the transient shelter form the storm of travel and even modern life more generally. [Link]
Currencies
‘World of Warcraft’ Currency Is Now Worth 7 Times as Much as Venezuela’s Cash by Chris Morris (Yahoo/Fortune)
Gold mined in World of Warcraft is used as an in-game currency and can be purchased with real-world currency. The WoW-Bolivar exchange rate has moved from 2:1 to more than 7:1 over the last year. [Link]
Should the Fed Create ‘FedCoin’ to Rival Bitcoin? A Former Top Official Says ‘Maybe’ by Neil Irwin (NYT)
A former Fed official who was under consideration for Fed Chair last year thinks that blockchain may be useful in the US payments system. [Link; soft paywall]
Economics
How Much Should We Trust the Dictator’s GDP Estimates? by Luis R. Martinez (SSRN)
Using tracking of economic activity based on night time illumination, Martinez argues that dictatorships regularly overstate real output by 15-30% of actual. [Link]
AEA Code of Professional Conduct (American Economic Association)
The AEA has introduced a professional code of conduct in a bid to enforce norms around civil discussion, equal opportunity, and representation in the discipline. [Link]
Scarce Life Savers
Final donation for man whose blood helped save 2.4 million babies by Kate Aubusson (Sydney Morning Herald)
A man with a rare concentration of antibodies which are helpful in preventing mothers’ immune systems from attacking the blood cells of their babies has been giving since the 1960s, saving millions of babies in the process. [Link]
The U.S. Is Facing an EpiPen Shortage by Anna Edney (Bloomberg)
Manufacturing delays have made EpiPens hard to come by, creating huge risks for millions who depend on easily available epinephrine in case of allergic reaction. [Link; soft paywall]
Why Monsanto and its rivals are trying to save butterflies by Danielle Wiener-Bronner (CNN)
Heavy use of RoundUp-ready crops mean that US farms have crowded out milkweed, the only plant where Monarch butterflies lay their eggs. Now Monstanto and other agrochemical companies are trying to reverse some of the damage. [Link]
Read Bespoke’s most actionable market research by starting a two-week free trial today! Get started here.
Have a great Sunday!
The Bespoke Report Newsletter — 5/11/18
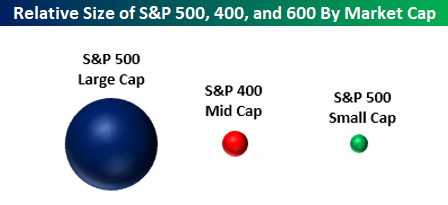
In this week’s Bespoke Report, one of the many topics covered was market weightings and market caps. The bubble chart below shows representations of the size of the large-cap S&P 500, the mid-cap S&P 400, and the small-cap S&P 600. When we speak with a lot of investors, we often hear these asset classes discussed like they are interchangeable. The reality is that they are very different. The S&P 500 is 29 times the size of the S&P 600 small cap index. Therefore, while it has little impact for an individual investor, collectively speaking, any new money in (or out) of the market will have a much more significant impact on small caps than it will on large caps. Think of it like dropping an ice cube in a full glass of water versus a bathtub.
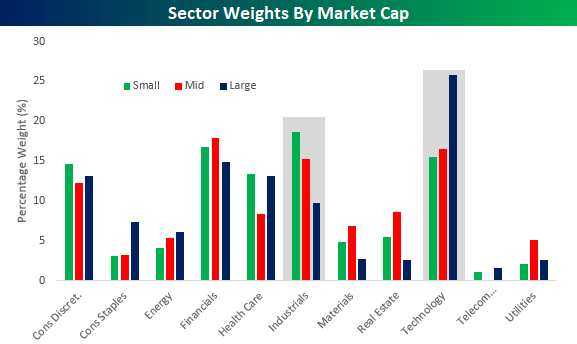
A second chart we wanted to highlight was sector weightings by market cap. While the Technology sector’s weighting is abnormally large in the S&P 500 large-cap index at over 25%, within the small and mid-cap indices, it is at a much more reasonable level of around 15%. In the small and mid-cap indices, the sector that has an abnormally large weighting is actually Industrials. Whereas the sector’s weight is under 10% in the S&P 500, it has a weighting of over 15% in the S&P 400 mid-cap index and a weight of over 18% in the S&P 600 small cap index.
With these weighting abnormalities in mind, when the Technology sector rallies, it has an exaggerated impact on large caps relative to small and mid caps, while an Industrials led rally has a more positive impact on mid and small caps.
As mentioned above, these charts are from our just-published weekly Bespoke Report newsletter, which provides an in-depth review of recent market action and events. To read this week’s Bespoke Report in its entirety, start a two-week free trial to any Bespoke membership level by clicking the button below.
The Closer: End of Week Charts — 5/11/18
Looking for deeper insight on global markets and economics? In tonight’s Closer sent to Bespoke clients, we recap weekly price action in major asset classes, update economic surprise index data for major economies, chart the weekly Commitment of Traders report from the CFTC, and provide our normal nightly update on ETF performance, volume and price movers, and the Bespoke Market Timing Model. We’ve recently added a section that helps break down momentum in developed market foreign exchange crosses as well.
Below is a snapshot from today’s Closer highlighting weekly intraday price charts for major equity indices and other asset classes. If you’d like to see more, start a free trial below.

The Closer is one of our most popular reports, and you can sign up for a free trial below to see it!
See tonight’s Closer by starting a two-week free trial to Bespoke Institutional now!
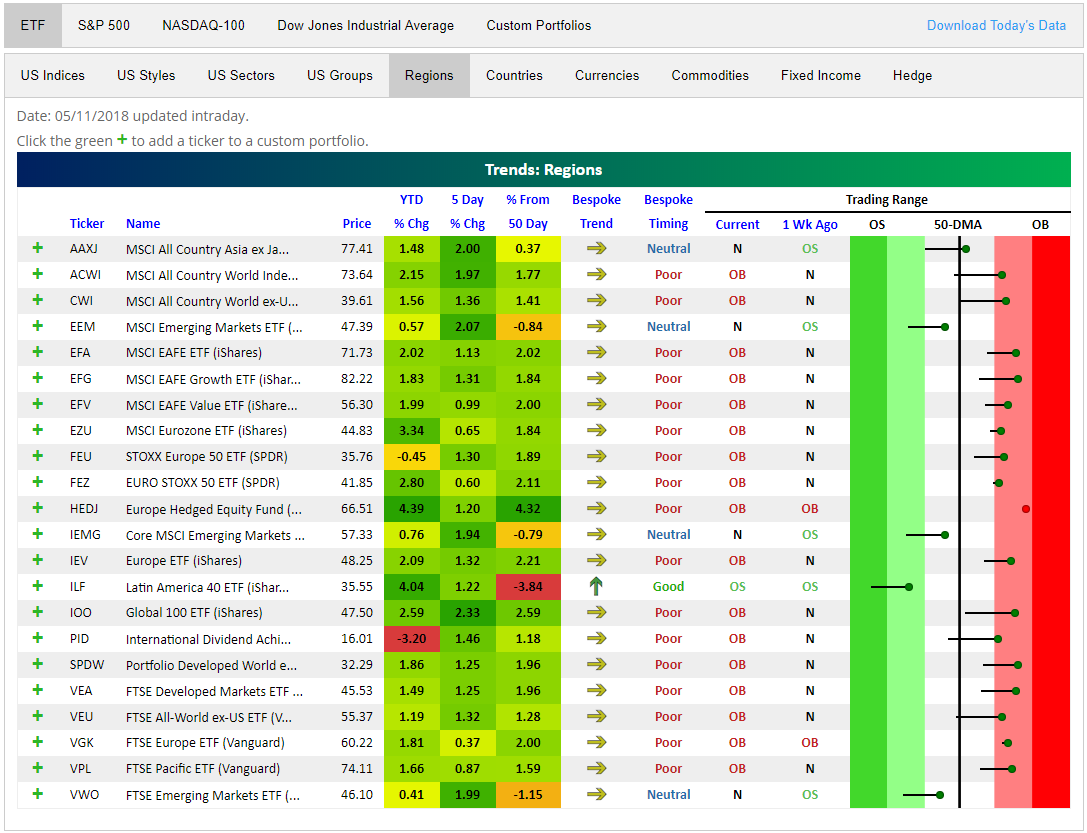
Global Stock Markets Back to Overbought
It took a few months, but global stock markets are mostly back to overbought levels. Below is a snapshot of regional ETFs from around the world using our Trend Analyzer Tool. You can see that every single one is up over the last 5 trading days, and only 4 of them remain below their 50-day moving averages.
Looking at the trading range section on the right side of the snapshot, all but 5 regional ETFs are trading in overbought territory, and just 1 is oversold (Latin America ILF).
Our Trend Analyzer Tool is one of many interactive features we’ve recently introduced to our premium research service. Other features include our Chart Scanner, Stock Seasonality Tool, Earnings Screener, Earnings Calendar, International Revenues Database, Economic Indicator Database, Earnings Triple Plays, and our Economic/Fed Monitor. As traders/investors ourselves, we’ve built all of these original tools to better serve our investment needs after years of learning and refining our approach. We use ALL of them every single trading day, and now our clients can use them as well! You can start using them now by joining Bespoke Premium or Bespoke Institutional!
Rest-of-Month Stock Market Seasonality
Bespoke’s Stock Seasonality Tool allows users to easily look up seasonal performance for US and international stock markets, individual stocks, and every asset class (through widely traded ETFs). When you visit the tool, it immediately shows you the S&P 500’s median change over the next week, month, and three months based on the last ten years worth of trading.
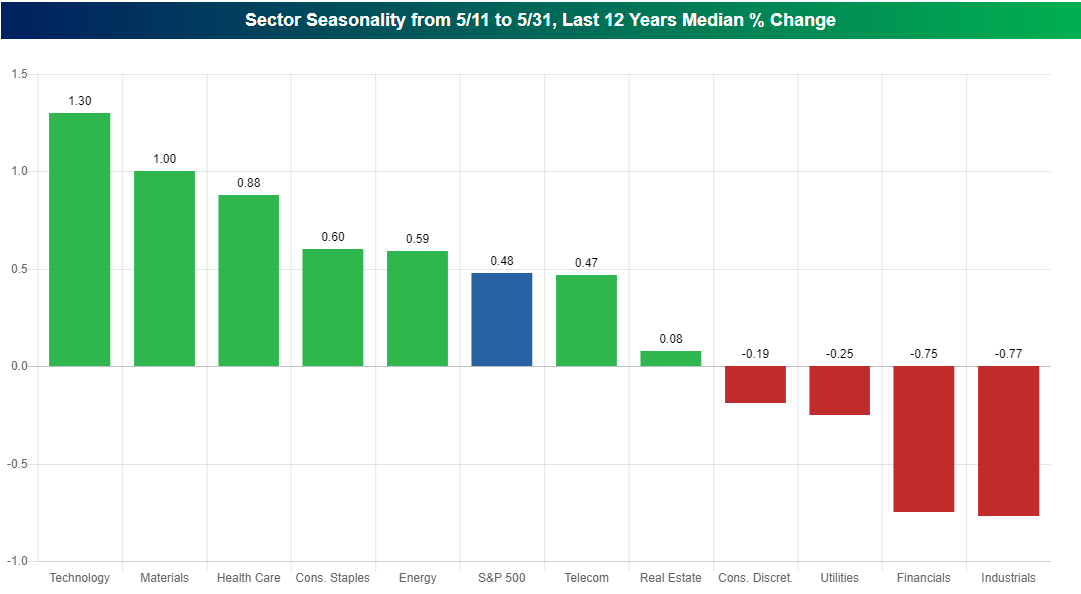
Below is a snapshot of a chart we pulled from the tool today showing historical sector performance for the remainder of May. The chart shows the median change that each S&P 500 sector has experienced from the close on May 11th through the close on May 31st over the last 12 years.
As shown, the S&P 500 as a whole has historically posted a median gain of 0.48% from May 11th through May 31st. That’s pretty good. But there has been quite a bit of disparity when it comes to the performance of various sectors during this time of the year.
The last 20 days of May have been a great time for the Technology and Materials sectors, which have both posted median gains of more than 1%, but it has been a rough time of the year for Financials and Industrials, which have both posted median declines of more than 0.75% over the same time frame.
The Stock Seasonality Tool is one of many interactive features we’ve recently introduced to our premium research service. Other features include our Chart Scanner, Trend Analyzer, Earnings Screener, Earnings Calendar, International Revenues Database, Economic Indicator Database, Earnings Triple Plays, and our Economic/Fed Monitor. As traders/investors ourselves, we’ve built all of these original tools to better serve our investment needs after years of learning and refining our approach. We use ALL of them every single trading day, and our clients can use them as well! You can start using them now by joining Bespoke Premium or Bespoke Institutional!