Bespoke Investment Group developed and maintains a three online interactive databases that are available to subscribers of our Bespoke Institutional offering. You can sample them now by signing up for a 14-day free trial to a monthly or annual Bespoke Institutional membership. These databases were created by our team of market experts, and they’re geared towards portfolio managers, analysts, and traders that follow the market on a regular basis. Our online interface is extremely user friendly, and Bespoke Institutional members can access the databases directly from the sidebar dashboard of the “members only” section of this site. Below we provide descriptions for all three databases.
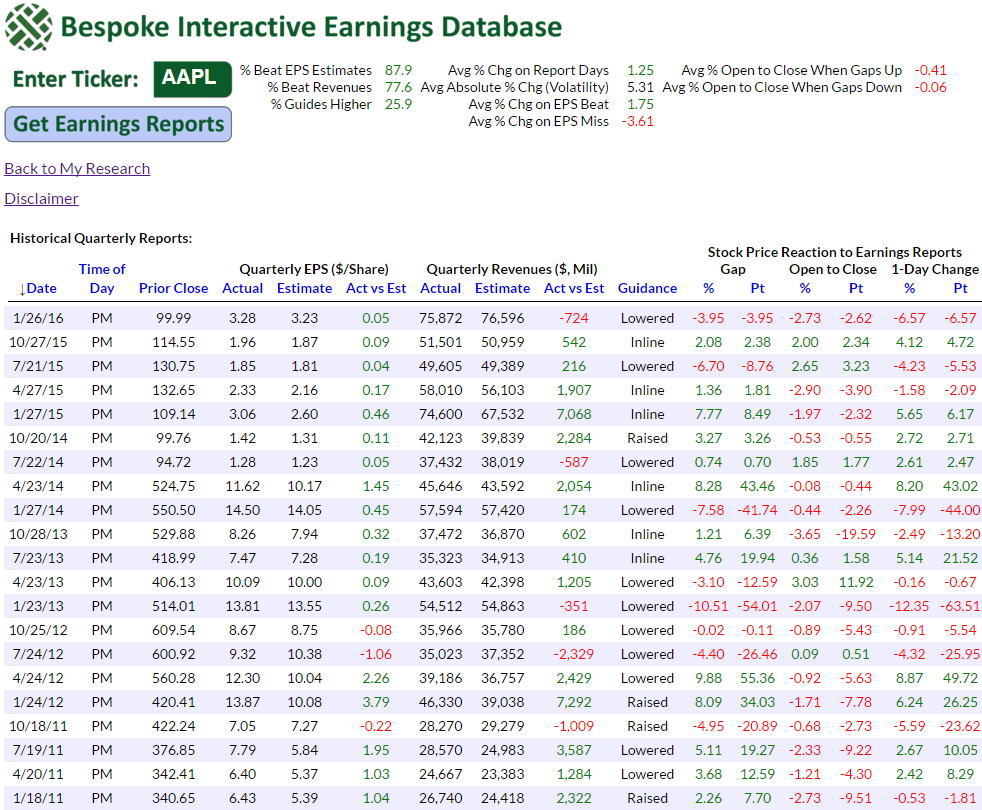
The Bespoke Interactive Earnings Database allows users to view historical quarterly earnings reports for nearly all U.S. stocks going back to the turn of the century (2001). Below is an inside look at the earnings information you’ll see when you search for an individual stock on our site. In this instance we highlight Apple’s (AAPL) quarterly reports going back to 2011, but as mentioned, the actual online database contains all reports going back to 2001. We also provide the database in Excel format for users looking to do back-testing or more in-depth analysis.
As shown, for each quarterly report, we highlight the company’s reported EPS and revenues versus consensus analyst estimates. We also highlight any guidance that was mentioned. This data allows users to easily track trends in both bottom and top line numbers for a company over time, and it also shows how often or not a company beats or misses estimates.
Along with the earnings and revenue data, we also include key price reaction data that sets our database apart from anything else you’ll find. For companies that report earnings after the close, we highlight its price reaction at the open the next morning and then from the open to the close. For companies that report earnings in the morning before the market open, we highlight its price reaction at the open that day and then from the open to the close. These performance numbers are then averaged and highlighted at the top of the database to show users how a stock typically performs in reaction to earnings, both when it beats or misses estimates and when it gaps up or down at the open. Over the years, users of our database have developed numerous trading strategies using this invaluable information.
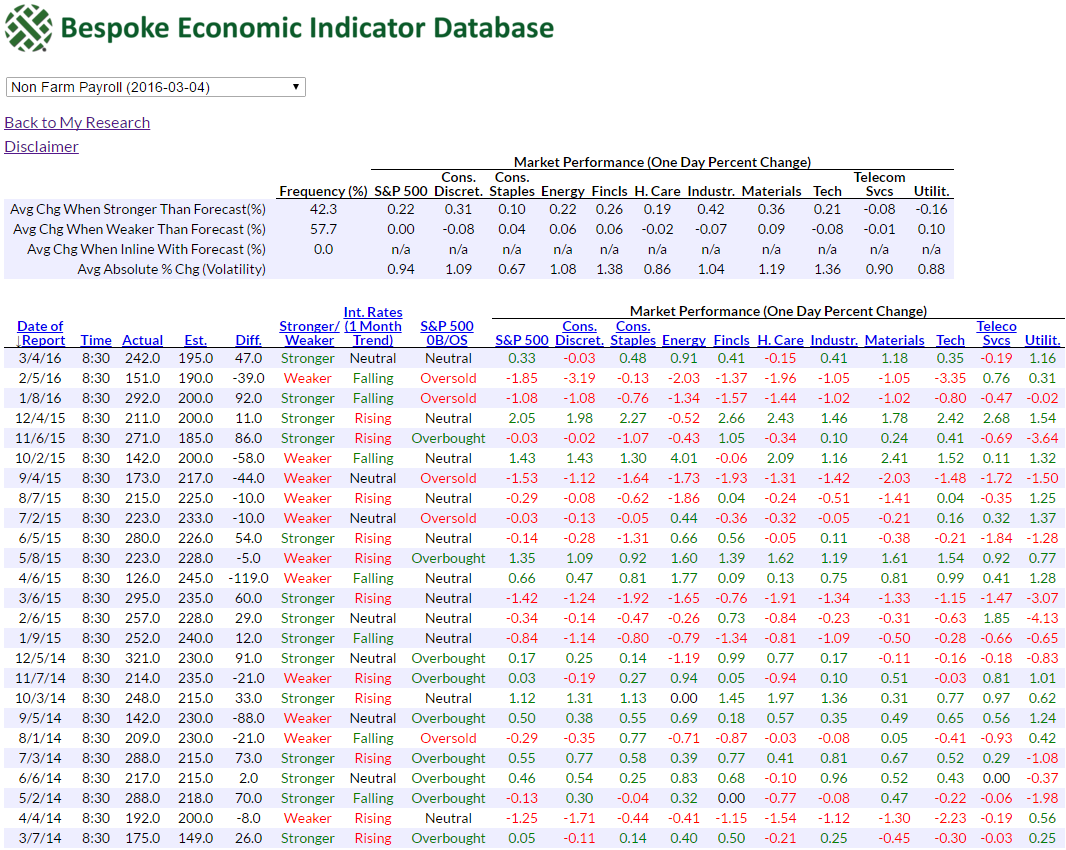
The Bespoke Economic Indicator Database contains historical release information for every U.S. economic indicator going back to 1998. Below is a snapshot of the database as seen by subscribers in the “members only” section of our website — in this instance we have pulled up the monthly Non Farm Payrolls report, only showing data back to 2014. In the actual online database, the monthly data goes back to 1998 as mentioned above.
As shown below, for each indicator, the database shows the release date along with the actual reading versus the consensus economist estimate at the time of the release. We also show whether the release came in stronger or weaker than expected, the one-month direction of interest rates at the time of the release, whether the market (S&P 500) was overbought or oversold at the time of the release, and the performance of the S&P 500 and its ten sectors on the day of the release. For each indicator, we also provide a summary of how often it has beaten or missed expectations over time, and how the S&P 500 and its ten sectors have performed on days when the report has come in stronger or weaker than expected. Users can also track the impact of the indicator on market volatility.
The Bespoke Economic Indicator Database is especially useful for back-testing purposes, and it also comes in handy as a tool to use in real-time when the various indicators are released each month. Users may request to view the database in Excel format as well.
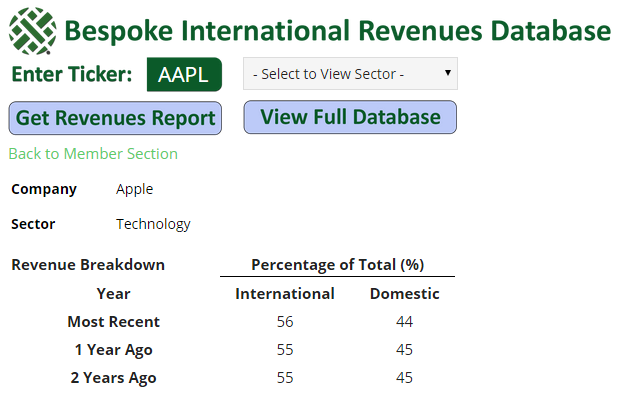
The Bespoke International Revenues Database provides geographic revenue exposure for every stock in the Russell 1,000. Below is a snapshot of the database when viewed in the “members only” section of our site.
While not closely followed, a company’s geographic revenue exposure can have a big impact on its stock price movement. US companies that generate a large portion of their revenues in Europe or Asia are impacted significantly by the economic cycles of these two regions, while companies that generate all or most of their revenues inside the US move more in-line with the domestic economy. In recent years, when the US lagged behind the rest of the world in terms of economic growth, the companies with heavy international revenue exposure significantly outperformed the companies with mostly domestic exposure. Conversely, when the US dollar has outperformed Europe and Asia, the domestic companies have routinely outperformed.
To invest using these global trends, you obviously need to know which companies are exposed the most to international and domestic revenue streams. Our International Revenues Database has this important data for all of the stocks in the Russell 1,000. There’s simply no better place to find this geographic revenue breakdown.
As mentioned earlier, our unique interactive databases are available to Bespoke Institutional members. You can test all of them out now by signing up for a 14-day free trial to Bespoke Institutional. Choose a monthly or annual membership option now!