Manufacturing: Doing Okay or In Collapse? It Depends Who You Ask.
Last night in The Closer, we discussed the huge divergence between regional Fed manufacturing activity indices and the ISM Manufacturing Index. In the chart below, we’ve created a proxy for the ISM Manufacturing Index by averaging sub-indices from various regional Fed manufacturing surveys. The result is generally well-correlated to ISM, but over the last few months the two have diverged wildly. While the Five Fed indices from the New York, Philadelphia, and Richmond Fed districts would indicate an ISM reading in the mid-50s, the actual readings have been deteriorating dramatically. Of course, these three Fed districts are a relatively small snapshot of the overall national economy, but collectively their sample size is similar to the ISM’s. It’s hard to say which is “right”, but the huge divergence is certainly noteworthy. Start a two-week free trial to Bespoke Institutional to stay up-to-date on all the latest developments in global financial markets and economics.
Cintas (CTAS) – Economic Bellwether?
After yesterday’s close, Cintas (CTAS) reported an earnings triple play (EPS and revenue beats along with raised guidance) posting record revenues and EPS. Given the nature of its business, which provides a variety of business services including uniform, cleaning, and first aid product distribution, CTAS should provide a reasonable gauge on the US business environment and more specifically, employment. With concerns rising over whether or not a recession is right around the corner, it would be a bit of a head-scratcher to see a company like CTAS post such strong results and trade close to record highs if the economy were in fact plunging into recession.

The chart below shows the performance of CTAS since its IPO with recessions overlaid with gray shading. Given the massive move higher the stock has seen over the last decade, it’s hard to see anything in the way of trends related to the performance of CTAS and recessions, but in additional charts below, we have looked at each period in more detail.

Each chart below shows the performance of CTAS in the year before, during, and year after each of the three prior recessions for which CTAS was a public company. Judging from the last three recessions, the stock’s performance has had a mixed track record of anticipating downturns.
In 1990, CTAS didn’t do a very good job anticipating the recession as it peaked right before the recession started. Once the contraction began, though, CTAS bottomed and anticipated the turn in the economy well before it began. While CTAS wasn’t a very good leading indicator of the 1990 recession, keep in mind that that slowdown was brought on by an oil price shock (after Iraq invaded Kuwait) that would be impossible to anticipate.
In 2001, CTAS did a much better job anticipating the recession as it peaked a full four months before the economy turned. It also did a decent job anticipating the turn in the economy as the stock started to rally over two months before the recession ended.
The performance of CTAS leading up to and after the last recession was probably the best example of it anticipating a recession and the subsequent turn as it was already weak well in advance of the recession’s start and bottomed (along with the rest of the market) in March 2009- over three months before the economy turned.
Judging by these three specific periods, CTAS has not been the best predictor of a looming recession in the past, but one thing it hasn’t done in the past is rally leading up to a recession and then continue to rally once the recession starts. Therefore, as CTAS continues to build on today’s post-earnings gain, it will be hard to argue that the economy is in the early stages of a recession. Start a two-week free trial to Bespoke Institutional to access our interactive economic indicators monitor and much more.

Fixed Income Weekly – 9/25/19
Searching for ways to better understand the fixed income space or looking for actionable ideas in this asset class? Bespoke’s Fixed Income Weekly provides an update on rates and credit every Wednesday. We start off with a fresh piece of analysis driven by what’s in the headlines or driving the market in a given week. We then provide charts of how US Treasury futures and rates are trading, before moving on to a summary of recent fixed income ETF performance, short-term interest rates including money market funds, and a trade idea. We summarize changes and recent developments for a variety of yield curves (UST, bund, Eurodollar, US breakeven inflation and Bespoke’s Global Yield Curve) before finishing with a review of recent UST yield curve changes, spread changes for major credit products and international bonds, and 1 year return profiles for a cross section of the fixed income world.
In this week’s report we review the concept of reserve scarcity.

Our Fixed Income Weekly helps investors stay on top of fixed income markets and gain new perspective on the developments in interest rates. You can sign up for a Bespoke research trial below to see this week’s report and everything else Bespoke publishes free for the next two weeks!
Click here and start a 14-day free trial to Bespoke Institutional to see our newest Fixed Income Weekly now!
Nike (NKE) New All-Time Highs After Earnings
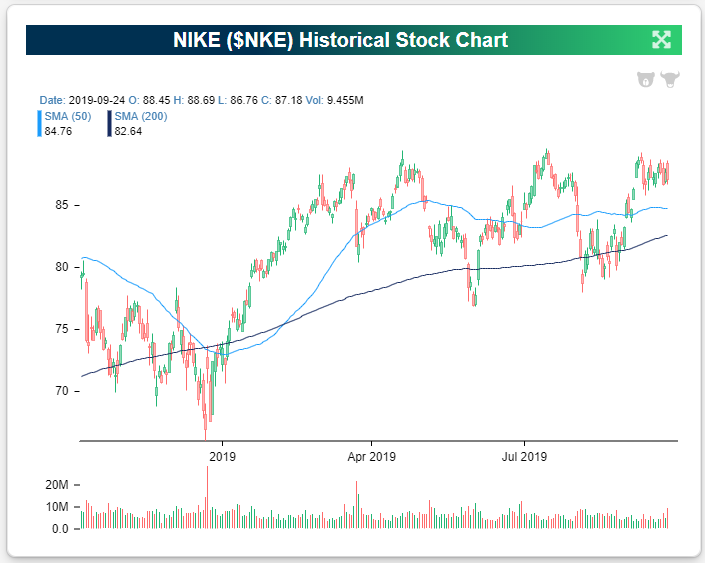
After reporting stronger than expected earnings last night after the close, Nike (NKE) is set to open at a new all-time high this morning. As highlighted in a post yesterday and shown in the chart below, the stock has been bumping up against resistance at the $90/share mark for all of 2019, but that resistance will be broken when the opening bell rings this morning based on where shares are trading in the pre-market.
The stock is currently up 5% in pre-market trading, which would be the 14th time NKE has opened higher by 5%+ on earnings since 2001. Below is a snapshot of the prior thirteen 5%+ gaps higher for NKE on earnings pulled from our popular Earnings Explorer tool. Notably, when these gaps higher have occurred, the stock has typically continued higher from the open to the close of trading as well. As shown in the “Open to Close” column, NKE has traded up from the open to the close after its initial 5%+ gap higher 9 out of 13 times for an average open to close gain of 1.25%. Start a two-week free trial to Bespoke Institutional to access our interactive Earnings Explorer and much more.

Bespoke’s Morning Lineup – 9/25/19
See what’s driving market performance around the world in today’s Morning Lineup. Bespoke’s Morning Lineup is the best way to start your trading day. Read it now by starting a two-week free trial to Bespoke Premium. CLICK HERE to learn more and start your free trial.

You may remember last week that we highlighted the S&P 500’s tendency for weakness towards the end of September, which is something we have started to see in the last couple of days. Looking ahead, the short-term outlook for the market based on seasonality still isn’t great, but the longer-term outlook doesn’t get much better. Based on our Seasonality tool, the S&P 500’s median three-month return from the close on 9/25 over the last ten years has been a gain of 7.10%, which is better than 99% of all other three-month rolling periods throughout the year.

The Closer – We Still Won’t, Oil Backwardation, Bearish Engulfing, Case-Shiller – 9/24/19
Log-in here if you’re a member with access to the Closer.
Looking for deeper insight on markets? In tonight’s Closer sent to Bespoke Institutional clients, we begin with a look at the massive spread in WeWork’s bonds following today’s headlines that CEO Adam Neumann will be stepping down. With the dust now settled after last week’s move in crude oil in the wake of attacks on Saudi facilities, we then review the shape of crude oil’s term structure. Next, we review the bearish engulfing pattern in the S&P 500. We finish with today’s economic data including Case-Shiller home prices, quarterly personal income, and an update to our Five Fed Manufacturing composite with today’s Richmond Fed release.

See today’s post-market Closer and everything else Bespoke publishes by starting a 14-day free trial to Bespoke Institutional today!
Chart of the Day: It’s the Economy, Stupid
Dividend Stock Spotlight: KeyCorp (KEY)
Regional banks (KRE) never entirely recovered from last year’s Q4 downturn and have underperformed both the broader market and the rest of the financial sector since. But one silver lining is that the group is attractive with regards to dividends. Of the regional bank stocks in the S&P 1500, 85% have a yield that outpaces the index and 63% have a higher yield than the financial sector. Currently, the average regional bank stock in the S&P 1500 yields 2.73%. One of the ones that yields even more at 4.2% is KeyCorp (KEY). Additionally, unlike some of the other regional bank stocks that have elevated yields due to downtrends over the past year, KEY has a more attractive chart and is actually sitting in a modest uptrend having made a series of higher highs and higher lows since the start of the year. Currently, the stock is experiencing mean reversion after reaching overbought levels.
Given this uptrend, the desirable yield has more been a result of steady and more recently rapid growth in the dividend rather than declines in stock price as is the case with other regional banks. Today, that dividend is 30% larger than it was just five years ago. That is more than twice the average growth of all regional bank stocks over the same time frame and nearly triple that of all financial stocks in the S&P 1500. Most of that growth has occurred in the past couple of years alone. More specifically, last September KEY raised its quarterly dividend by 5 cents (from $0.12 to $0.17), rather than the one-cent increases observed in previous years. The most recently declared dividend was also raised another 2 cents to $0.19. With a payout ratio of 42%, KEY has some safety in its dividend; even with this recent growth. Start a two-week free trial to Bespoke Institutional to access our interactive Security Analysis tool and much more.

Nike (NKE) Ready to Jump On Earnings?
After the bell today, Nike (NKE) is scheduled to report third-quarter results. The stock has been pretty flat over the past six months swinging between ~$89 and ~$76, although, it has put in a series of higher lows since the start of 2019. Earlier this month marked yet another failed attempt (third time testing these levels) of NKE to break out, but over the past few weeks since that test of resistance, the stock has been coiling not far off these levels. All of this is in the context of a longer-term uptrend over the past couple of years, which means a solid earnings report could be just the catalyst needed to send the stock to new highs.

NKE is forecasted to report EPS of 71 cents and revenues of $10.4 billion. If the company meets these top-line estimates, it would be a record sales figure, representing a 4.88% growth rate YoY. In regards to EPS though, NKE is coming off of a disappointing quarter. Looking at the past several years of earnings data for NKE in our Earnings Explorer, after 27 consecutive quarters with an EPS beat, the company missed estimates by 4 cents back in June. Despite this, the stock price did not see any excessively negative reaction. In fact, NKE traded up 0.35% on its earnings reaction day which is not necessarily unusual as the stock’s price reaction to earnings has historically held a positive bias. On average, NKE has finished the day after earnings higher by 1.55% and has been positive 63% of the time. Start a two-week free trial to Bespoke Institutional to access our interactive Earnings Explorer and much more.
