Chart of the Day: Brent Busts Out
Nike (NKE): Just Doing It on Earnings for Six Years
Nike (NKE) has been a beast lately. Since launching its new Colin Kaepernick campaign in conjunction with the start of the 2018 NFL season earlier this month, the stock has added $6 billion in market cap, traded to new all-time highs, and now leads the Dow 30 in year-to-date performance. This weekend Nike got another boost when Tiger Woods — maybe the most well-known athlete in the world and forever linked with Nike — won his first PGA Tour event in five years. Seriously, the company is on a roll.
Nike (NKE) likely won’t be making any big sports news on Tuesday, but investors will get to see how good of a quarter the company had when it releases earnings results after the close tomorrow. Historically, Nike has been a beast on earnings as well.
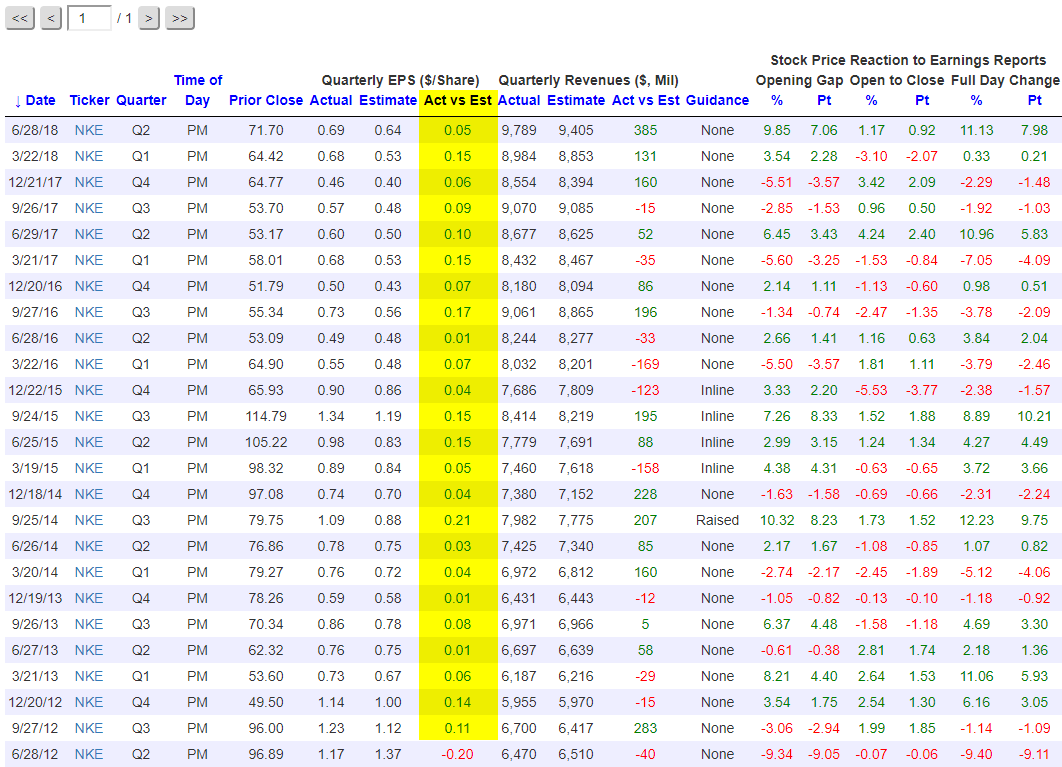
Our Interactive Earnings Screener lets users pull up historical quarterly earnings results for any company dating all the way back to 2001. (Be sure to check out the Screener at some point if you have yet to do so.) Below is a snapshot of Nike’s quarterly results from our Screener dating back to June 2012.
Highlighted in yellow in the snapshot below is the difference between Nike’s actual EPS number and its consensus analyst EPS estimate. As shown, Nike (NKE) has beaten earnings estimates for 24 consecutive quarters (6 years) dating back to September 2012! The last time Nike missed earnings was in June 2012. Back then, Colin Kaepernick was one year into his NFL career as Alex Smith’s back-up in San Francisco. Later that year Kaepernick would go on to replace an injured Smith in week 10, sparking a QB controversy under Coach Jim Harbaugh that ultimately led to Kaepernick keeping the job and taking the 49ers to Super Bowl 47 where they lost to the Baltimore Ravens.
On June 28th, 2012 when Nike last missed EPS estimates, Tiger Woods was beginning play in the AT&T National at Congressional in Bethesda, MD — a tournament he would go on to win by 2 strokes ahead of Bo Van Pelt. It was Tiger’s 3rd and final PGA Tour win of 2012 after going win-less since 2009 when his affair allegations first broke.
While Nike has managed to beat EPS estimates for 24 consecutive quarters, the company has only beaten revenue estimates 15 out of its last 24 quarters. The revenue misses have not impacted stock performance in reaction to earnings by much, however. Over Nike’s last 24 earnings reports, the stock has averaged a one-day gain of 2.11% on its earnings reaction days with positive returns posted 58% of the time. Over the same time frame, we’ve seen more than 64,000 quarterly reports across the US stock market, and the average stock has gained 0.01% on its earnings reaction day.
All of the earnings stats quoted in this article come from our Interactive Earnings Screener, which is available for use as part of our Bespoke Institutional package. It’s truly an invaluable tool for investors. Start a two-week Bespoke Institutional free trial to try it out today.
Leading Indicators Shows No Signs of Slowing
The analysis below is pulled from last Friday’s Bespoke Report newsletter. To read the full report, start a two-week free trial to any of our three membership levels.
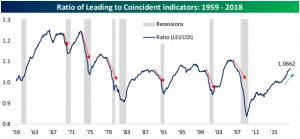
The Leading Indicators report released this past Thursday reinforced signals of a strong US economy. From this release, there do not appear to be signs of a looming recession. Below we show the ratio of Leading Indicators to Coincident Indicators over the past 60 years. Historically, this ratio has been a very good leading indicator of recessions. Typically, but not always, when the ratio peaks then begins to fall, a recession is around the corner. This does not mean that a recession is necessarily in the near future. In fact, the ratio usually peaks in excess of a year before a recession and typically rolls over by the time the recession starts. Last Thursday’s reading showed no signs of a reversal; rising to a cycle high of 1.0662.
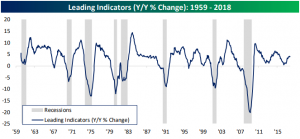
Another way of looking at this indicator is on a year-over-year basis. This tells much of the same story. Months or even years before a recession begins, the reading peaks then begins to decline. Right before a recession, it has never been on the rise.
August’s report came in at 6.41%, which is the second-highest level since July 2014. Since 1980, the earliest a recession came following a period where the y/y change in leading indicators was above 5% was 24 months. The average amount of time that elapsed from the last 5% or more reading to the earliest stages of a recession was 35 months. No matter which way you cut it, the Leading Indicators do not show signs of a slowing economy.
The analysis above is pulled from last Friday’s Bespoke Report newsletter. To read the full report, start a two-week free trial to any of our three membership levels.
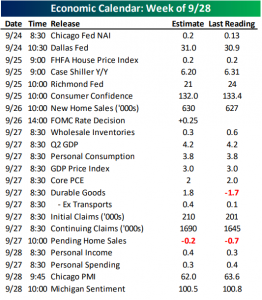
This Week in Economic Data
Last week was fairly quiet on the economic data front. This week is set to be busier with 22 US reports including an anticipated rate hike by the FOMC on Wednesday. Some releases worth mentioning are Consumer Confidence on Tuesday; followed by Michigan Confidence on Friday. Additionally, Thursday will be a busy day of economic data with the third release of Q2 GDP alongside Personal Consumption, Core PCE, Durable Goods, and Pending Home Sales. On Thursday we will also see if jobless claims continue to impress. Finally, after last week’s mixed manufacturing reports from the NY Fed and Philly Fed, Friday’s Chicago PMI release can hopefully provide some clarity to the overall manufacturing outlook of the US.
As always, you can see all of the day’s economic releases with our Economic Monitor.
The Dirty Dozen
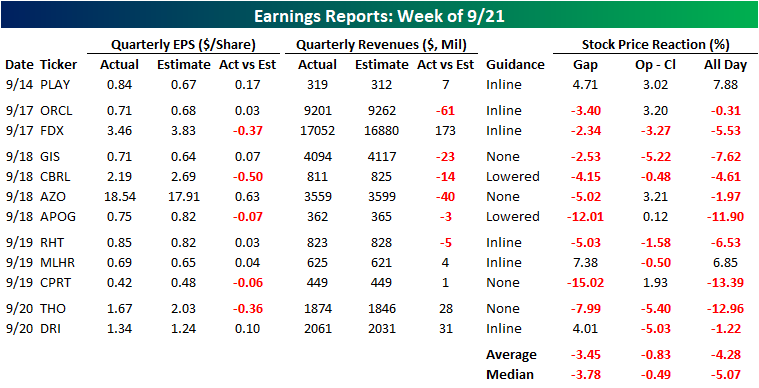
In numerous reports over the last several months for both clients and on the blog, we have repeatedly highlighted the positive impact of earnings and the reaction of investors to them as an important driver for the market. In recent quarters, the percentage of companies exceeding EPS forecasts has consistently been strong in the mid-60% range. Earnings season doesn’t really kick off for another two to three weeks, so it will be impossible until then to see if any of the strong earnings trends are shifting. That being said, early indications haven’t been positive. Using our Earnings Report Screener, we found that in what was an admittedly limited sample size, the twelve companies that reported earnings last week generally had weak results and even weaker stock price reactions.
As shown in the table below, only twelve companies reported earnings last week, but of those, just seven exceeded bottom line EPS forecasts, while only six beat on the top line. A number of these companies were small-cap companies, but FedEx (FDX) had a pretty notable EPS miss, while Oracle (ORCL) missed on the top line, which led both to decline on their earnings reaction days. Overall, stock price reactions were, to put it mildly, bad. Of the 12 companies reporting EPS last week, ten of them saw declines on their stock price reaction days for an average decline of 4.28% and a median drop of just over 5%. Again, it’s a limited sample size, but if Q3 earnings season comes in as bad as these early indications, it could be a long Fall.
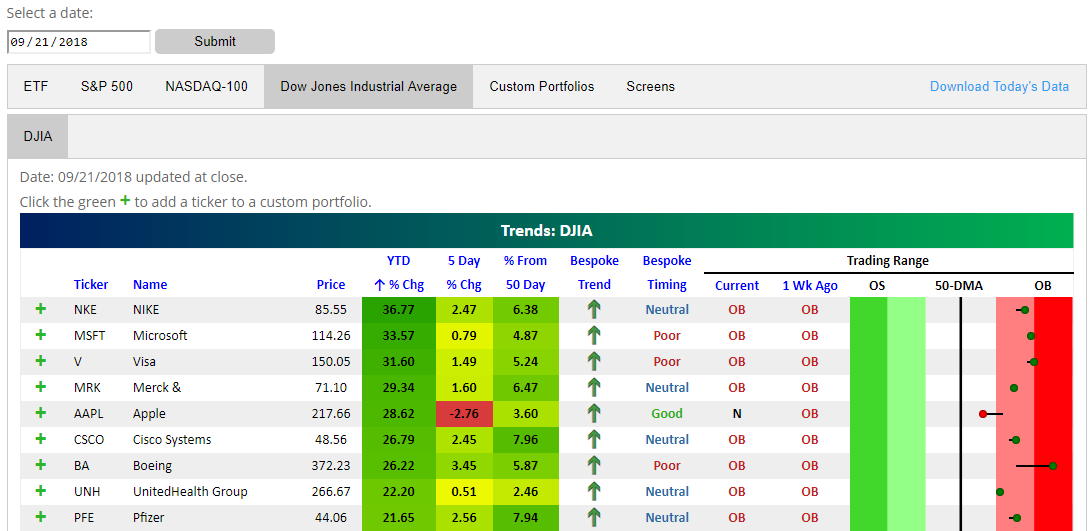
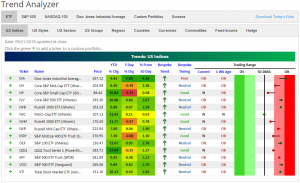
Trend Analyzer – 9/24/2018 – Small and Mid Cap Lag Behind
We are starting off the week with our Trend Analyzer showing most major US Index ETFs as overbought. Currently, 9 are overbought, 5 are neutral, and none are oversold. The Dow (DIA) still leads the group having seen the largest gains last week. Micro-Cap (IWC) is back at its 50-DMA. This is below where it was on Friday but still is an improvement from where it was for the better portion of last week.
As we mentioned last week, small and mid cap ETFs have been underperforming recently. Most of these funds have seen either losses or are barely positive in this time span. Notably, the Core S&P Small-Cap (IJR) has the second greatest gains YTD, but over the past week it has been selling off. At its current level, the ETF has fallen 1.15% over the last week, moving from overbought to just above its 50-DMA.
September has so far been a month that has seen the equity market gain, but new leadership has emerged as the year’s previous winners have experienced mean reversion. This is a sign of a healthy market.
Bespoke Morning Lineup – Pre-Market News and Analysis
US equities look like they are going to kick off the week on a down note today as the latest tit for tat trade spat between the US and China continues. Both Chinese and Japanese equities were closed for holidays overnight, and European equities are broadly (but not sharply) lower to kick off the week.
As noted in last week’s Bespoke Report, the US stock market is coming off a strong period for the bulls as the S&P 500 has rallied in eight of the last ten sessions completing what was a textbook technical pattern breaking out, testing the original breakout point, and then making a run for new highs.

Start a two-week free trial to Bespoke Premium to see today’s full Morning Lineup report. You’ll receive it in your inbox each morning an hour before the open to get your trading day started.

Bespoke Brunch Reads: 9/23/18
Welcome to Bespoke Brunch Reads — a linkfest of the favorite things we read over the past week. The links are mostly market related, but there are some other interesting subjects covered as well. We hope you enjoy the food for thought as a supplement to the research we provide you during the week.
Economics
Heterogeneous effects of trade agreements across product types by Rebecca Freeman and Samuel Penknagura (Voxeu)
This assessment of modern trade agreements gauges which groups of goods see the most volume gains in response to new agreements. Just like in real estate, the answer comes down to location, location, location. [Link]
Record-Low 12% Cite Economic Issues as Top U.S. Problem by Frank Newport (Gallup)
Gallup has been asking consumers how they feel about the economy for almost 30 years now and they’ve never been less concerned about the state of the economy. [Link]
Conspicuous Consumption
Pimp Your Ride: Splurge on a Lower License-Plate Number by Scott Calvert (WSJ)
A new – or maybe an old made new again – trend in high dollar consumer goods: license plates with low numbers are attracting huge interest from those with money to burn. [Link; paywall]
How Puerto Rico Became the Newest Tax Haven for the Super Rich by Jesse Barron (GQ)
A look at the latest tax dodge employed by the wealthiest Americans, featuring an easily dodged requirement to relocate to the gorgeous, friendly, and fiscally strapped US territory of Puerto Rico. [Link]
Insurance
Life Insurance Offering More Incentive to Live Longer by Paul Sullivan (NYT)
While the idea of reporting your step count to your insurer via an Apple Watch is appealing to some, John Hancock’s new policy of requiring reporting of wellness activity also has a faintly dystopian angle. [Link; soft paywall]
Gaming
Fortnite has now been cited in more than 200 divorce proceedings by William Hughes (AV News)
Given the obsessive activity from millions of players, it shouldn’t be a surprise that Fortnite is being cited as a reason (admittedly, probably only one of many in most cases) as a cause of divorce. [Link]
Sports
For you sports fans out there (and/or gamblers), here are our week 3 NFL picks versus the spread.
North Texas explains the (amazingly elaborate) FAKE FAIR CATCH touchdown trick by Alex Kirshner (SBNation)
A detailed analysis of one of the most impressive trick plays that’s been run in years: a fake fair catch which North Texas ended up taking back for a touchdown against Arkansas. [Link]
Tech
Europe’s New Copyright Law Could Change The Web Worldwide by Klint Finley (Wired)
Following closely on the heels of wide-reaching GDPR privacy regulation, the European Parliament passed sweeping copyright legislation that would force the use of “upload filters”, preventing upload of copyrighted material. [Link]
Comedy
Soviet Jokes for the DDCI (CIA)
Declassified jokes collected by the CIA in the old Soviet Union are a good source of laughs, both in their own right and as part of a meta joke that they were ever classified in the first place. [Link; 2 page PDF]
A resident of New Bern, NC, may in fact have a new boat by Brendan Greeley (FTAV)
This classic of the FT Alphaville blogging genre takes a throw-away comment by the President and runs through the full legal and economic analysis, with a healthy dose of policy implications alongside. [Link; registration required]
Read Bespoke’s most actionable market research by starting a two-week free trial today! Get started here.
Have a great Sunday!
2018 Week 3
Week 2 Results: 8-6, Overall: 17-11 (60.7%)
Outside of financial markets, we’re also sports fans here at Bespoke. With new legal sports betting avenues now available across the US, we figured we’d have some fun and pick each NFL game versus the spread this season (as of Saturday evening). Let’s see how we do…on to Week 3.
After going 9-5 versus the spread in Week 1, we were 8-6 in Week 2 with one push. This brings our overall record through 2 weeks to 17-11 (60.7%).
2018 NFL Week 3 Bespoke Picks:
New Orleans at Atlanta (-1.5): New Orleans +1.5
San Francisco at Kansas City (-6.5): Kansas City -6.5
Oakland at Miami (-3): Miami -3
Buffalo at Minnesota (-16.5): Minnesota -16.5
Indianapolis at Philadelphia (-7): Indianapolis +7
Green Bay (-2.5) at Washington: Green Bay -2.5
Cincinnati at Carolina (-3): Cincinnati +3
Tennessee at Jacksonville (-9.5): Tennessee +9.5
Denver at Baltimore (-5.5): Denver +5.5
NY Giants at Houston (-6): NY Giants +6
LA Chargers at LA Rams (-7): LA Rams -7
Chicago (-4.5) at Arizona: Chicago -4.5
Dallas at Seattle (-1.5): Seattle -1.5
New England (-7) at Detroit: New England -7
Pittsburgh (-1) at Tampa Bay: Pittsburgh -1
Week 3 Picks: 9 Favorites, 6 Dogs; 5 Home, 10 Away
2018 NFL Week 2 Bespoke Results:
Carolina at Atlanta (-6): Carolina +6 (Loss)
LA Chargers (-7.5) at Buffalo: LA Chargers -7.5 (Win)
Minnesota at Green Bay (Even): Minnesota Even (Push)
Houston (-3) at Tennessee: Tennessee +3 (Win)
Cleveland at New Orleans (-9.5): New Orleans -9.5 (Loss)
Miami at NY Jets (-2.5): NY Jets -2.5 (Loss)
Kansas City at Pittsburgh (-5): Kansas City +5 (Win)
Philadelphia (-3) at Tampa Bay: Philadelphia -3 (Loss)
Indianapolis at Washington (-6): Indianapolis +6 (Win)
Arizona at LA Rams (-13.5): LA Rams -13.5 (Win)
Detroit at San Francisco (-6): San Francisco -6 (Loss)
Oakland at Denver (-6.5): Oakland +6.5 (Win)
New England (-1.5) at Jacksonville: Jacksonville +1.5 (Win)
NY Giants at Dallas (-3): NY Giants +3 (Loss)
Seattle at Chicago (-3): Chicago -3 (Win)
The Bespoke Report — Passing With Flying Colors
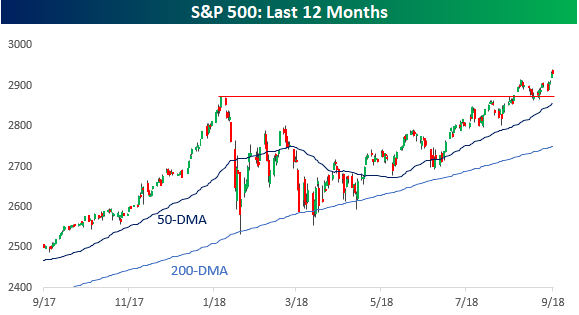
School has been back in session for less than a month now, but the S&P 500 already had its first test of the semester and came out passing with flying colors. After breaking out to new highs at the end of August, the S&P 500 pulled back in early September and found support right at its prior highs from January. After holding that level, the S&P 500 has now traded higher on eight of the last ten trading days, rallying to higher highs. It doesn’t get much more textbook than that!
Heading into the week,the DJIA was the only major US index that had yet to take out its January high, but that changed this week as the index closed out the week with four straight days of gains. While most other indices ran into resistance on their first attempts to take out their highs from January, the DJIA just buzzed right through it.
We’ve just published our latest weekly Bespoke Report newsletter, which is available to subscribers across all three of our membership levels. Sign up here to read the report.
To get up to speed on our thoughts regarding the market’s direction going forward, choose any membership option and access this week’s full Bespoke Report newsletter after signing up! You won’t be disappointed. Some of the topics discussed in this week’s report include:
- Index and sector breadth checkup
- US economy update
- What major indicators say about the odds of a recession
- How recent earnings report stack up
- An ‘Industrious’ rally
- Commodities and the Materials sector
- Mutual fund and ETF flows
- High yield spreads
- Rotational forces
- Model Growth Portfolio update