The Bespoke Report — Stumbling And Bumbling
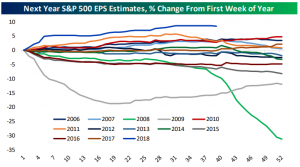
While the economy is on good footing and the overall backdrop is reasonably positive for stocks, there’s reason to be a bit cautious. EPS estimates have been rising sharply this year relative to history, and that process may be completing. While it’s not certain that the bar being set by analysts is too high, stocks have gotten a tailwind from stronger earnings estimates all year; if that process goes into reverse, equity market gains would require higher valuation. While possible, this late in the economic cycle and given higher interest rates, it would be prudent to not rush to expectations of the same climb in valuations that we saw earlier in this bull market.
We’ve just published our latest weekly Bespoke Report newsletter, which is available to subscribers across all three of our membership levels. Sign up here to read the report.
To get up to speed on our thoughts regarding the market’s direction going forward, choose any membership option and access this week’s full Bespoke Report newsletter after signing up! You won’t be disappointed. Some of the topics discussed in this week’s report include:
- Why chaos in the headlines doesn’t mean chaos for stocks
- US economy update
- Check in Europe: Italian chaos, slow inflation, but firm credit growth
- Recent global trade and industrial production volumes
- Breakouts in APAC equity indices and some improvements in EM
- Weak earnings reactions since the end of the last earnings season
- Chinese economic data recap
- Review of the Fed rate hike this week and current FOMC thinking
- Improving credit spreads despite high debt-to-GDP levels
- Focus on homebuilders: versus housing data and valuations
- Model Growth Portfolio update
The Closer: End of Week Charts — 9/28/18
Looking for deeper insight on global markets and economics? In tonight’s Closer sent to Bespoke clients, we recap weekly price action in major asset classes, update economic surprise index data for major economies, chart the weekly Commitment of Traders report from the CFTC, and provide our normal nightly update on ETF performance, volume and price movers, and the Bespoke Market Timing Model. We also take a look at the trend in various developed market FX markets.
Below is a snapshot from today’s Closer highlighting the current positioning of speculators in US interest rate markets. If you’d like to see more, start a free trial below.

The Closer is one of our most popular reports, and you can sign up for a free trial below to see it!
See tonight’s Closer by starting a two-week free trial to Bespoke Institutional now!
Stocks Tanking on Earnings Heading Into Q3 Reporting Period
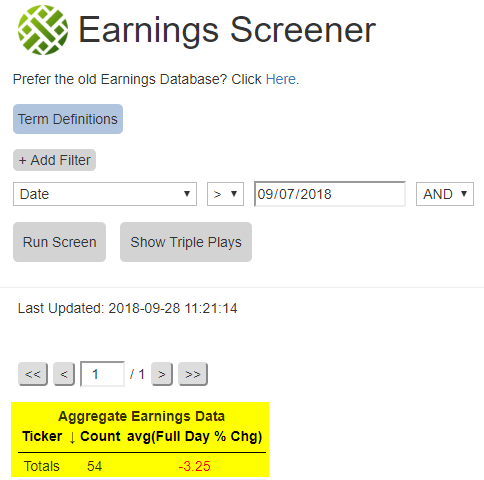
The third quarter earnings period starts up in early October, and if September is any guide, it’s going to be a long earnings season for investors. Over the last two weeks, 54 companies have reported earnings (the number of companies that report during the “off season” is much lower), and their stocks have averaged a one-day decline of 3.2% on their earnings reaction days. That’s an absolutely brutal reading, and while it’s a small sample size, it suggests that investors are not liking what they’re seeing from corporate America.
Below is a snapshot from our Earnings Screener, which allows users to pull up earnings stats like the one mentioned above. It’s available at the Bespoke Institutional level, which you can access with a two-week free trial.
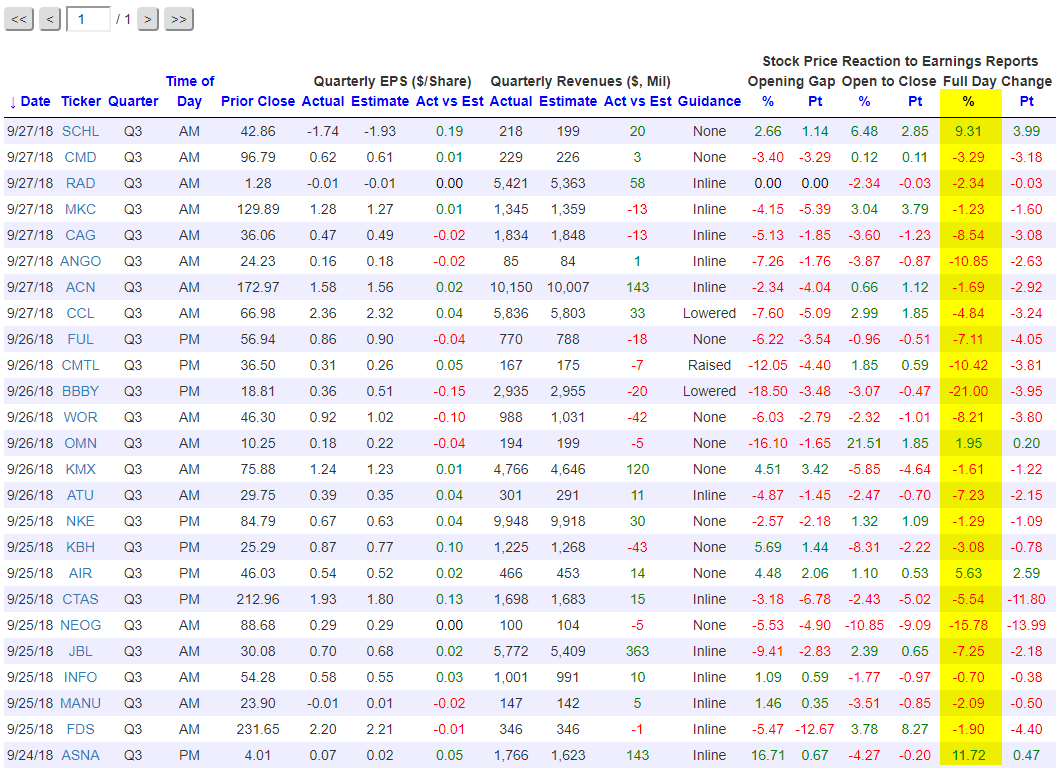
Below is a snapshot pulled from our Earnings Screener showing the stocks that reported earnings just this week. We’ve highlighted each stock’s one-day price change in reaction to the earnings news. As you can see, there’s a lot of red! In fact, the average one-day change for the stocks that reported this week was a decline of 3.6%, and only 4 of the 25 stocks that reported ended up gaining on their earnings reaction days.

Most Heavily Shorted Stocks Tank in September
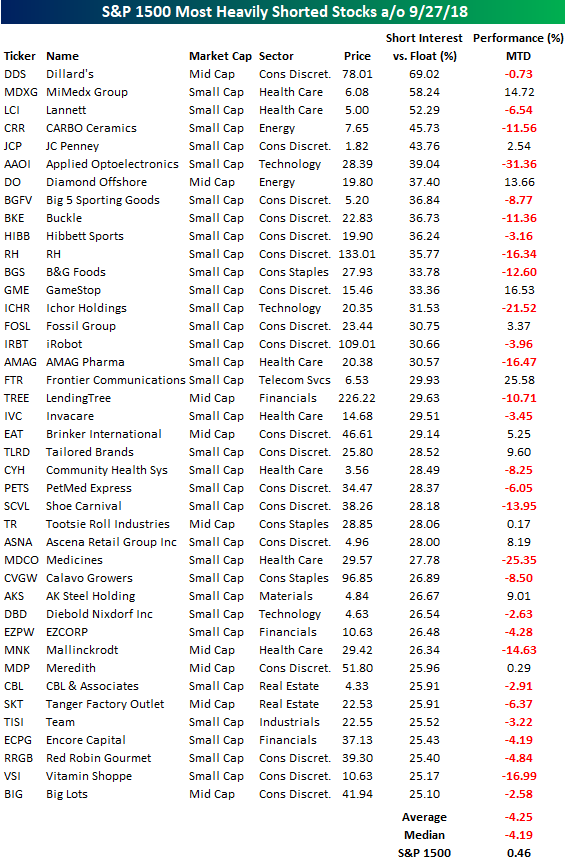
We published our regularly updated Short Interest Report earlier today in order to show clients which areas of the market are seeing the biggest increases and decreases in short interest levels. A supplement to the report is the table below highlighting the most heavily shorted stocks in the S&P 1500.
Notably, the most shorted stocks got crushed in September (through 9/27), falling 4.25% on average compared to a small gain for the S&P 1500. While the stock market was up in September, it wasn’t a great month for stocks that the shorts are bettign heavily against.
Dillard’s (DDS) is the most heavily shorted stock in the entire S&P 1500 with 69% of its float sold short. Two other stocks in the index have more than 50% of their shares sold short — MiMedx Group (MDXG) and Lannett (LCI). Some of the other stocks on the list below that got hit the hardest in September include Applied Opto (AAOI), Ichor Holdings (ICHR), and Medicines (MDCO), which all fell more than 20%.
Equities may have traded higher in September, but it looks like the shorts were still able to make plenty of money.

The Closer — Hard Data Wave — 9/27/18
Log-in here if you’re a member with access to the Closer.
Looking for deeper insight on markets? In tonight’s Closer sent to Bespoke Institutional clients, we wade through an enormous wave of data released in the US today covering GDP, trade, manufacturers’ sales, new orders, and inventories, and inventories. We also discuss our now-complete Five Fed Index of regional manufacturing activity and some odds and ends from equity, credit, and FX markets.

See today’s post-market Closer and everything else Bespoke publishes by starting a 14-day free trial to Bespoke Institutional today!
Chart of the Day: Mosaic (MOS)
Individual Investors Turn a Bit More Bullish
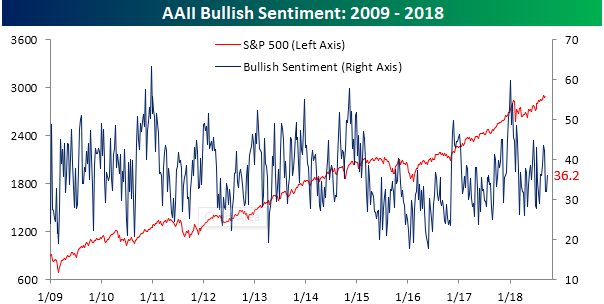
With the Dow Jones – America’s “Main Street” equity index – joining the S&P at new highs to close out last week, we were not too surprised to see that individual investors turned more bullish in the latest week. But even after the increase, positive sentiment remains at extremely depressed levels given what the market has done recently. According to the weekly survey from AAII, bullish sentiment rose from 32.04% up to 36.22%. That’s still below the average reading of 36.7% for the current bull market.
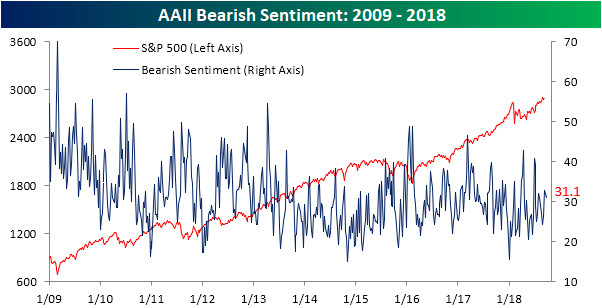
Even with the increase in bullish sentiment, bearish sentiment barely declined, falling less than one percentage point from 32.0% down to 31.1%.
The main source for the increase in bullish sentiment came from the ‘fence-sitters’ as neutral sentiment declined from 35.9% down to 32.7%.

Jobless Claims Rise More Than Expected
Before we go any further this morning, we hope you’re sitting down for this one because it’s a shocker. OK, are you ready for it? Here it goes. This week’s report on initial jobless claims was actually a bit disappointing. While economists were expecting claims to tick up to 210K, the actual reading came in at 214K. This week’s increase represents the largest one week rise in claims since May and put the actual reading at the highest level in a month. Even with the ‘disappointing’ report this morning, this week’s claims number represents the 186th straight week where claims were at or below 300K, the 51st straight week where claims were at or below 250K (longest streak since 1970), and the 12th week where claims were at or below 225K. So even a disappointing report wasn’t all that bad in the grand scheme of things.
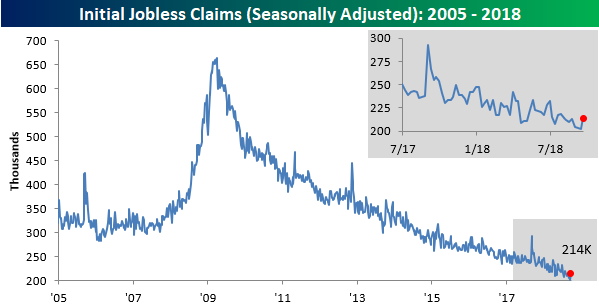
Although claims rose by 12K this week, the four-week moving average only rose by 250 to 206.25K, so that’s still right near the multi-decade low that was reached last week.

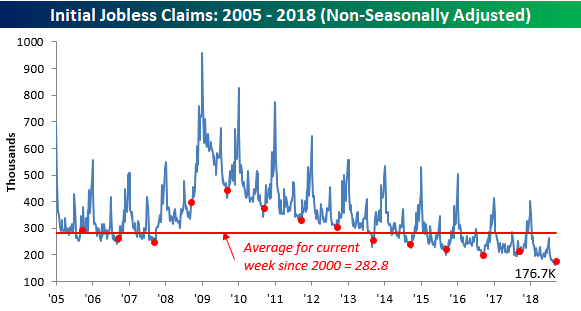
Finally, on a non-seasonally adjusted basis, jobless claims rose from 169.2K up to 176.7K. Even with the increase, though, it’s the lowest reading for the current week of the year since 1969 and more than 100K below the average of 282.8K for the current week of the year dating back to 2000.
Trend Analyzer – 9/27/18 – Nasdaq is the Sole Survivor
In reaction to the Fed hiking rates yesterday, equity markets fell with some areas seeing greater declines than others. Every major US Index ETF has moved below where it stood this time last week, with the exception being the Nasdaq 100 (QQQ). Up the most YTD of all these indices, it almost should not come as a surprise that it has withstood the hit of the Fed Day, still up 1.04% over the past 5 trading days. It was also the only ETF of this group to have seen any gains at all at the close. Every other major US Index ETF was down on the day. QQQ, along with the Dow (DIA), is the only remaining overbought ETF. All others have moved to neutral.

The Closer — Fed Hikes, Banks & Builders Falter — 9/26/18
Log-in here if you’re a member with access to the Closer.
Looking for deeper insight on markets? In tonight’s Closer sent to Bespoke Institutional clients, we recap the Fed decision today before diving into the collapse of bank stocks, new home sales data, and the decline in homebuilder stocks. We also recap EIA petroleum market data along with recent Energy price action.
See today’s post-market Closer and everything else Bespoke publishes by starting a 14-day free trial to Bespoke Institutional today!