Morning Lineup – Three in a Row?
It wasn’t looking that way early yesterday afternoon, but with two positive days in the books and futures pointing to a higher open today, the S&P 500 could have its first three-day winning streak since the end of November. The fact that asset allocators are being forced to buy equities to get their portfolios back into balance with their benchmark weightings could add further fuel to the fire. After all, we saw the same trend play out in the last few days of October and November as well. Then again, nothing is guaranteed in this market lately, and the difference between a big up day or down day is simply the timing of when the last buy or sell program of the day hits, sending stocks careening in one direction or the other.
Read today’s Bespoke Morning Lineup below for major macro and stock-specific news events, updated market internals, and commentary.
Bespoke Morning Lineup – 12/28/18
Yesterday’s reversal which followed a big up gain the day before certainly has helped to provide a boost to sentiment, but as we mentioned in yesterday’s commentary, while the type of action we have seen in the last couple of days has ultimately led to better than average returns over the following year, in the short-term, there was usually more downside.
Take yesterday’s reversal in the Nasdaq. After trading down over 3% intraday, the late-day rally in the Nasdaq to finish in positive territory was just the 20th time since 1985 that the index was down at least 3% intraday and finished in positive territory. Of the 19 prior occurrences, 18 of them occurred either between 2000 and 2002 or in 2008. Chasing those rallies didn’t turn out particularly well.

Start a two-week free trial to Bespoke Premium to see today’s full Morning Lineup report. You’ll receive it in your inbox each morning an hour before the open to get your trading day started.

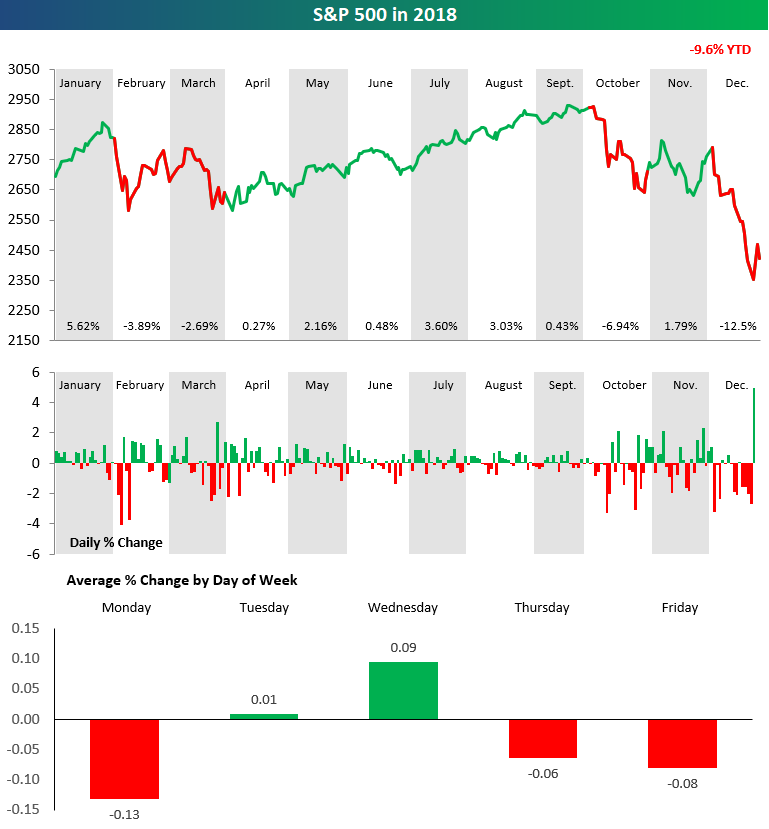
S&P 500 US Stock Market Snapshot — 2018
Below is a snapshot of the S&P 500’s performance in 2018. After a huge gain of 5.62% in January, the index stumbled in February and March before setting out on a six-month winning streak from April through September. Once October rolled around, though, you-know-what hit the fan. A 7% drop in October provided a jolt to the senses for investors. In November, the S&P saw a small gain, but then the bottom completely fell out in December with a 12.5% decline (thus far).
In the second chart below, we show the daily percentage change for the S&P throughout the year. You can clearly see that during the two downturns (in Feb/Mar and Oct-Dec), volatility picked up significantly, while it was smooth sailing during the spring and summer.
Finally, in the third chart, we show the S&P’s average change by weekday this year. As shown, Monday has been the worst day of the week this year with an average decline of 0.13%. Friday has been the second worst, while Thursday ranks third worst. Tuesday and Wednesday both averaged gains. Be sure to read our 2019 Bespoke Report for a more in-depth recap of the year and our expectations on the year ahead.
S&P 500 Sector Trading Range Charts
Below is an updated look at our trading range charts for the S&P 500 and ten sectors. It’s not a pretty sight.
In each chart, the red shading represents overbought territory, while the green shading represents oversold territory. Investors certainly don’t have to worry about overbought levels right now! In fact, the S&P and all ten sectors are trading roughly 2 or more standard deviations below their 50-day moving averages even after yesterday’s big rally.
For the S&P 500, you shouldn’t even start to get excited until the index can re-take 2,578, which we point out in the first chart below. That level is now a big resistance point. Unfortunately, it will take a rally of 7.2% to get there! The bulls certainly have their work cut out for them.
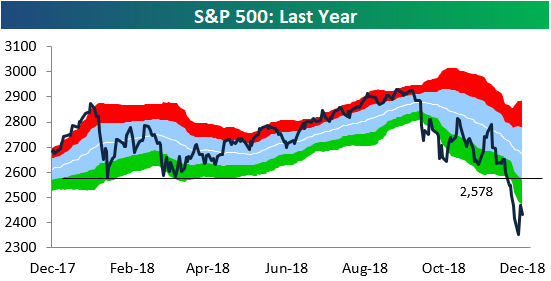

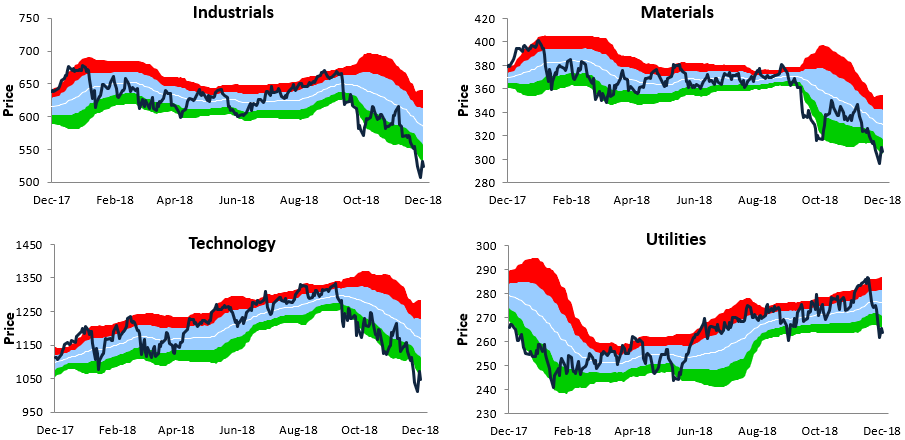
Chart of the Day: Play Defense With P&G
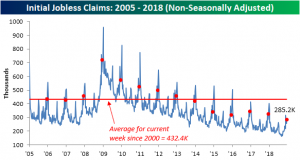
No Surprises From Jobless Claims
This week’s initial jobless claims data came in without any surprises and little changed after some large movements only a few weeks ago. Claims came in this week at a seasonally adjusted 216K, down 1k from a revised 217K for the prior week. This is right in line with consensus economist expectations for 216K. This week marks the 64th week in a row that claims have come in at or below 250K. The indicator is also closing in on 200 weeks in a row of coming in below 300K. This week is the 199th week below that level. It should have no problem hitting that milestone this time next week.
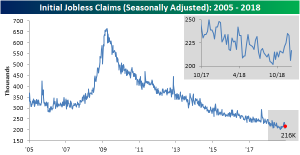
With the elevated levels from late November now rolling off, the four-week moving average ticked down this week to 218K from 222K last week.

Claims came in higher on a non-seasonally adjusted basis at 285.2K; roughly a 30K increase from last week. This increase is not of any concern seeing as it is entirely in line with seasonal patterns. This week’s non-seasonally adjusted print of 285.2k is the lowest for this specific week of the year since at least 2000.
Gas Prices Plummet
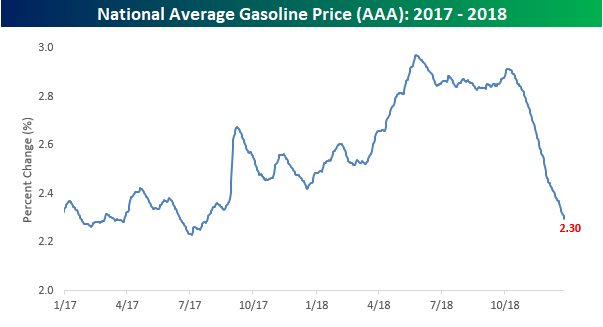
While falling stock prices have provided a beat down to the values of Americans’ 401ks in the fourth quarter of 2018, falling prices at the pump have added a little bit of a cushion to their wallets. Through yesterday, the national average price of a gallon of gas was just under $2.30, which is down from just under $3 a gallon back around Memorial Day weekend. That’s the lowest national average price since the Summer of 2017.
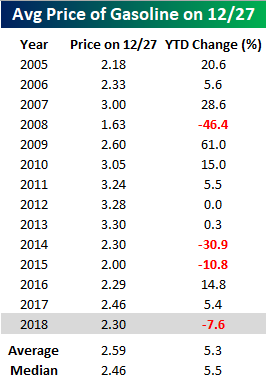
With the recent decline, gas prices are poised to decline over 7% for the year, which would make this just the fourth year since 2005 that prices were down. The other three years were 2008 (-46.4%), 2014 (-30.9%), and 2015 (-10.8%). Compared to the average annual increase of over 5%, consumers got off easy this year!
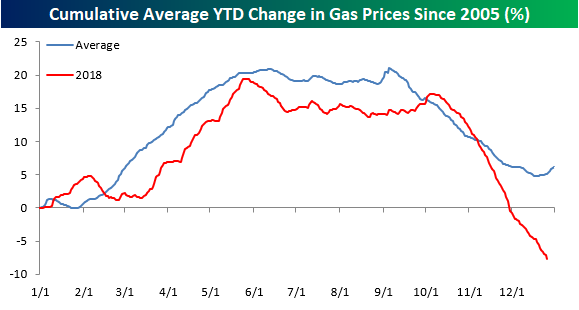
While gas prices have been considerably weaker than normal in 2018, the weakness was primarily a fourth-quarter story. The chart below compares average prices this year to a composite of all prior years since 2005. Right up until the start of October, prices were tracking their average very closely, and while the late year weakness came right on cue this year, its intensity was much stronger than normal as crude oil prices plummeted. While market watchers figured stock market weakness would crimp holiday sales, the positive impact of gas prices seems to have more than counteracted that negative pull.
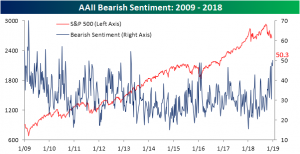
Bears Back in Full Force
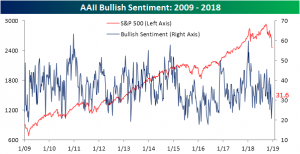
In spite of major declines in the past week, bullish sentiment through the AAII survey of individual investors actually rose for the second week in a row to 31.6%. That is up from the very low 24.9% reading from last week and an even lower 20.9% the prior week.
Turning to bearish sentiment, this week’s readings are similar to what we anticipated from last week’s release. As we previously mentioned, due to the timing of the survey, the heavy losses following the FOMC’s rate decision and Fed Chair Powell’s press conference did not likely fully come into play. That is not the case this week, and after continued weakness right up until Christmas Eve, it comes as no surprise that bearish sentiment jumped to just above 50%, completely overtaking last week’s small downtick. Bearish sentiment has remained at elevated levels for some time now, but the last time investors were this pessimistic was back in April 2013.
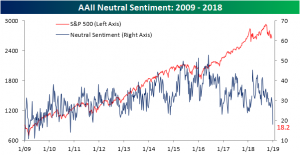
With both Bullish and Bearish sentiment increasing, Neutral sentiment fell significantly. The current reading is down 9.7% from last week to a multi-year low of 18.2%. The last time that neutral sentiment was this low was back in November 2010.
Morning Lineup – Giving Some Back
We were bound to give some of it back, but even with futures suggesting a near 300 point decline at the open, that would only take us back to levels we traded at 30 minutes before yesterday’s closing bell! For bulls, the weakness at the open should actually be welcome. If yesterday’s buying was real money coming in, you would expect to see this morning’s weakness met with buying later on in the morning. So, that will be the test to watch for.
Read today’s Bespoke Morning Lineup below for major macro and stock-specific news events, updated market internals and commentary.
Bespoke Morning Lineup – 12/27/18
Volatility has definitely made a comeback over the last two months, so much so that the S&P 500’s average daily range has now ticked up to 1.19%. While we are nowhere near the record levels of over 4% from the peak of the Financial Crisis, the current level is the highest since early 2012. Just another indicator showing how the current environment is a major shift from recent history.

Start a two-week free trial to Bespoke Premium to see today’s full Morning Lineup report. You’ll receive it in your inbox each morning an hour before the open to get your trading day started.
Trend Analyzer – 12/26/18 – Further Oversold
A shorter session and the Christmas holiday did nothing to stave off further declines on Monday. This can be seen through our Trend Analyzer. All of the ETFs tracking the major indices are currently extremely oversold. The tails are very short meaning they have not moved very far from where they were this time last week. To further hammer home just how oversold these ETFs are, every single one is more than 12% below its 50-day moving average.
The past few months of steep declines are now fully visible through year-to-date performance as well. The Nasdaq (QQQ) is still the best performer even though it is now down 7.35%. The rest are down 10%+ YTD with the Micro-Cap (IWC) down the most at 18.06%.
