Morning Lineup – Optimism on Trade and a Truce in DC
Lawmakers in DC have reportedly come to an agreement on keeping the government open, and the President has agreed to go along with it. Can you believe it?? Elsewhere overnight, there is some optimism on US-China trade talks, while economic data in Europe continues to stink up the joint. Read all about overnight events and this morning’s news in today’s Morning Lineup.
Bespoke Morning Lineup – 2/13/19
Yesterday was a pretty momentous day for the stock market. Not only did the S&P 500 close back above its 200-DMA (barely), but the percentage of stocks hitting new highs also reached its highest point since December 3rd, before the big whoosh lower. With the rally, though, the percentage of stocks that are short-term overbought has reached its highest level since January 26th of last year. That by no means suggests we are due for a repeat of what happened following that last reading, but does indicate that short-term technicals are getting a bit stretched and that the market may need to pause and catch its breath.

Start a two-week free trial to Bespoke Premium to see today’s full Morning Lineup report. You’ll receive it in your inbox each morning an hour before the open to get your trading day started.

The Closer — 200 Day Reclaimed, Job Openings Insane, Consumer Credit Explained — 2/12/19
Log-in here if you’re a member with access to the Closer.
Looking for deeper insight on markets? In tonight’s Closer sent to Bespoke Institutional clients, as the S&P 500 finally closed above its 200-DMA, we show the returns following similar periods where the index spent several weeks below its average. In addition to returns, we look at how breadth has held up in those same periods as today was the highest percentage of net new highs since early December. Next, we provide an updated look at December’s JOLTS report from the BLS which continues to show a very strong labor market. After that, we turn our attention to the NY Fed’s quarterly release of consumer credit data which showed continued growth in debt to record levels. We delve in depth into this credit data to get a read on the health of consumer credit.

See today’s post-market Closer and everything else Bespoke publishes by starting a 14-day free trial to Bespoke Institutional today!
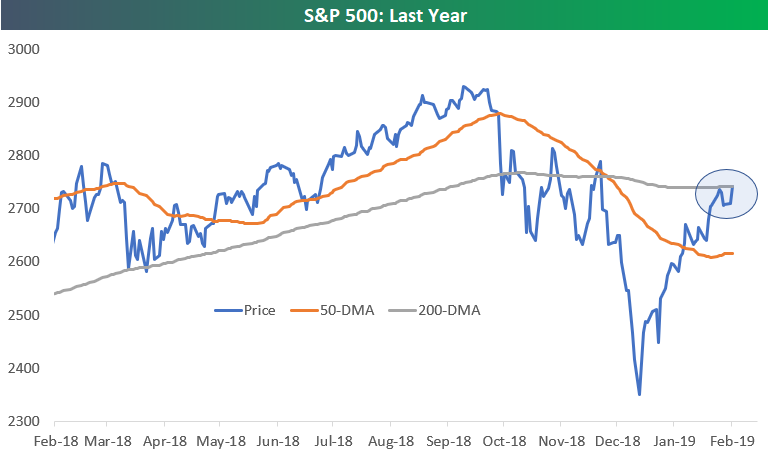
S&P 500 Re-Testing the 200-DMA
The S&P 500 is up 1.2% today, and the gains have the index once again testing resistance at the 200-day moving average. Last Tuesday we failed the first test, and now we’re seeing another test today. With the S&P’s price right at 2,742 as we type, the index needs to rally just over a point up to 2,743.36 to get to the 200-day. A close above the 200-day would be viewed as a win by market technicians, and the index can then set its sights on the next level of resistance right around 2,800. Let’s see how the day finishes. If the recent pattern of late-day buying that we’ve been seeing continues today, it will make the snowy trek home from Wall Street a bit more bearable!
High Standards for Twilio (TWLO)
Our newly-released Earnings Explorer, which is available to all Bespoke Institutional clients, is a great new tool for investors to utilize when companies in their portfolios have an earnings report coming up. It’s also a great tool to find new ideas and short-term trade opportunities. While in no way meant as a recommendation to buy or sell the stock ahead of earnings, the analysis below of Twilio (TWLO), which reports after the close on Tuesday, is meant instead as a way to highlight some of the aspects of our Earnings Explorer tool.
For more in-depth earnings season analysis, start a two-week free trial to Bespoke Institutional and receive full access to our amazing Earnings Explorer tool.
Headed into its Q4 earnings report, the growth technology stock TWLO has set a high bar for itself. We have flagged the stock in our Bespoke 50 for some time now as one of the top growth stocks in the Russell 3000 in addition to it earning the accolade of best-performing stock of 2018. This comes in part as a result of the company’s recent history of strong earnings reports. Scheduled to report after the close today (2/11), TWLO is coming off of back-to-back quarters of Earnings Triple Plays—beating EPS and sales estimates while also raising guidance. While time will tell if we see back-to-back-to-back Triple plays (something that certainly no one should be banking on but is also not totally out of the question), strong earnings reports are definitely nothing new for the company.
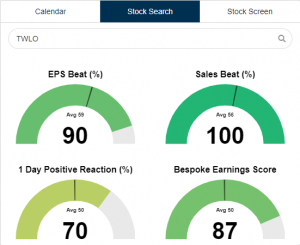
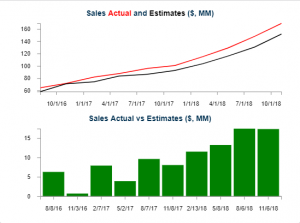
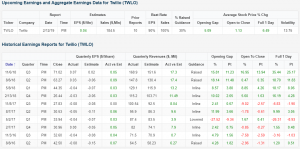
Below we provide snapshots from our new interactive site’s Earnings Explorer showing a summary of how TWLO typically reports relative to expectations and then how it reacts to those reports. Below that we show the growth of EPS and revenues for the company over time.
The top two gauges below show TWLO’s EPS and Sales beat rates at 90% and 100%, which is considerably better than the market averages of 59% and 56%, respectively. The two gauges below that show the percentage of time that the stock has reacted positively to its historical earnings reports (70%), while the other gauge shows the Bespoke Earnings Score, which is a proprietary measure which takes into account how often a stock exceeds EPS and revenue forecasts as well as how the stock typically reacts to beats or misses.
In the ten quarters that TWLO has been public, it has beaten EPS estimates 90% of the time. The only exception was in November 2017 when EPS were in line with forecasts and the stock dropped 7% on its earnings reaction day. Even more impressive, the company has a flawless record when it comes to sales; sales have come in above estimates every single time the company has reported. Aside from topping forecasts, EPS and revenues have been steadily increasing over the past couple of years since TWLO went public.
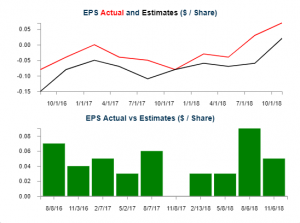
With such a strong track record of EPS and revenue beats, investors have noticed and increasingly flocked to the stock over the past year. 2018 did not see a single quarter in which TWLO didn’t rise 16% or more on its earnings reaction days. Last quarter, the stock saw a remarkable full day gain of 35.44%! While the stock has been positive more than negative, TWLO has a history of volatility in both directions, averaging a move of +/-13.75% change on earnings days. Contrary to last quarter’s jump, looking back to its report in May 2017, TWLO lowered guidance and the stock dropped over 26% on its earnings reaction day. Also, gaps higher are not always indicative of gains on the day. Throughout 2016 and 2017, the stock typically gapped higher only to shed some or all of these gains throughout the day.
In other words, while the stock has, for the most part, reacted very well on earnings days, the insanely positive response has been more or less a 2018 phenomenon. Turning to Tuesday’s report, while there is no reason there can’t be another strong report along with huge upward price movement, and more specifically last quarter, volatility for the stock cuts in both directions. Additionally, with four straight quarters of such strong reactions to earnings, TWLO no doubt faces very optimistic expectations.
Small Business Confidence Takes Another Fall
Small business confidence as measured by the NFIB saw it’s fifth straight monthly decline in January, falling from 104.4 down to 101.2 and below consensus expectations of 103.0. Uncertainty was definitely the main issue driving the drop in confidence, though, as the NFIB’s Uncertainty Index rose seven points to the fifth highest monthly reading (86) in the survey’s history. As shown in the chart below, the NFIB’s headline index of Small Business Optimism has now declined from a multi-decade high of 108.8 in August to 101.2 with declines in each month in between. What is notable about this decline is that the current reading of 101.2 is the lowest level since November 2016, indicating that the bulk of gains we saw in confidence since the 2016 election have been erased.
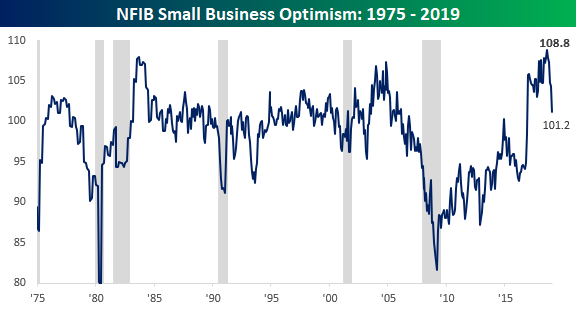
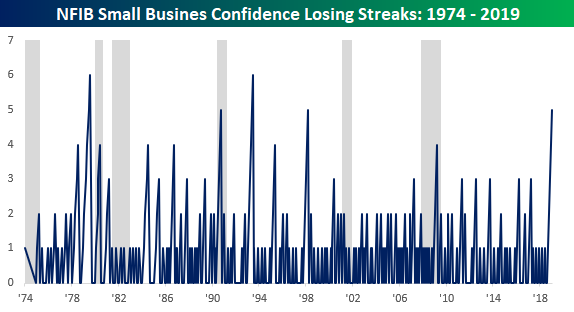
With five straight months of declines, the NFIB Small Business Optimism Index in the midst of its longest monthly losing streak since 1998 and tied for its third-longest losing streak on record. While those stats may sound ominous, as the chart above and below indicate, both peaks in NFIB and long streaks of monthly declines in NFIB haven’t necessarily been the best predictors of a recession (gray shaded areas).
While small businesses grew increasingly concerned over the uncertainty regarding the government shutdown and trade, when it comes to their biggest problems, Washington still isn’t at the top of the list. Quality of Labor continues to be the biggest problem for small business as it was cited by 23% of those surveyed. Taxes clocked in at 15%, while Government/Red Tape came in at 12%, which was actually down from 14%. Maybe with the government shutdown, there was less bureaucracy to deal with??
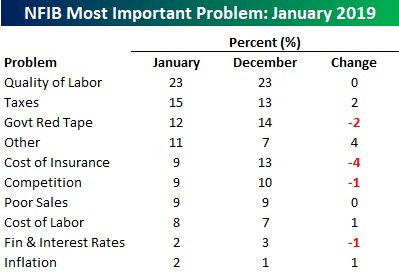
Not only are Taxes and Government/Red Tape not at the top of the list anymore but on a combined basis, they haven’t been this small of a problem since the last recession.
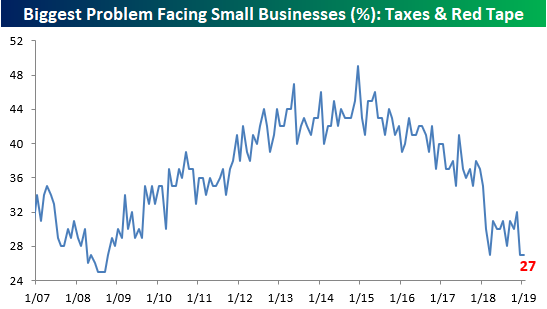
Chart of the Day: Earnings Reactions Looking Pretty Healthy
Bespoke’s S&P 500 Sector Weightings Report — February 2019
S&P 500 sector weightings are important to monitor. Over the years when weightings have gotten extremely lopsided for one or two sectors, it hasn’t ended well. Below is a table showing S&P 500 sector weightings from the mid-1990s through 2016. In the early 1990s before the Dot Com bubble, the US economy was much more evenly weighted between manufacturing sectors and service sectors. Sector weightings were bunched together between 6% and 14% across the board. In 1990, Tech was tied for the smallest sector of the market at 6.3%, while Industrials was the largest at 14.7%. The spread between the largest and smallest sectors back then was just over 8 percentage points.
The Dot Com bubble completely blew up the balanced economy, and looking back you can clearly see how lopsided things had become. Once the Tech bubble burst, it was the Financial sector that began its charge towards dominance. The Financial sector’s sole purpose is to service the economy, so in our view you never want to see the Financial sector make up the largest portion of the economy. That was the case from 2002 to 2007, though, and we all know how that ended.
Unfortunately we’ve begun to see sector weightings get extremely out of whack once again.
If you would like to see the most up-to-date numbers for S&P 500 sector weightings, simply start a two-week free trial to our Bespoke Premium or Bespoke Institutional services. Click back to this post to see the numbers once you’re signed up!

Trend Analyzer – Mixed Monday – 2/12/19
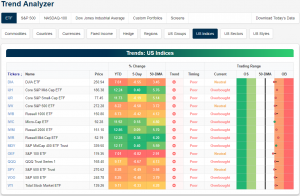
Major indices were mixed yesterday as late-day buying helped to save some, but not all, indices from seeing losses on the day. Some indices like the large-cap Dow (DIA) and tech-heavy Nasdaq (QQQ) came up short putting them further into the red over the past five days. Whereas one week ago every one of the major index ETFs sat in overbought territory, only four are neutral while the other ten are overbought. Those ETFs that are neutral are comprised of the large caps: the Dow (DIA) and S&P 100 (OEF) as well as the S&P 500 indices (SPY and IVV). Also over the past week, the small and mid-caps are the only indices to edge out gains. These are also the indices that have outperformed year to date. Recent price action has begun to show a more drastic divergence between these small and mid-caps and the rest of their peers. For example, the Russell 2000 (IWM) has been the best index so far this year up 12.85%; other similar ETFs are not far behind in performance. Meanwhile, the large-cap S&P 100 (OEF), though it hasn’t seen a loss, is only up just over 7%.
Morning Lineup – Small Business Confidence Sags
Deal or no deal? That is the question for today as Congressional negotiators have apparently reached an agreement on averting a government shutdown. Now the only question is whether or not the President will go along with it. We’ll be on the lookout for the tweet! US equity futures are trading higher on the news, and while yesterday’s last hour did not see a big rally, it was the eighth straight day of gains in the final 60 minutes of trading! Read all about overnight events and this morning’s news in today’s Morning Lineup.
Bespoke Morning Lineup – 2/12/19
Small business optimism came in significantly weaker than expected today falling from 104.4 down to 101.2. That 3.2 point decline was the largest m/m drop since June 2015. While a big drop is concerning, the temporary factor of the government shutdown probably played a large role. Also, looking at a long-term chart, peaks in the NFIB index haven’t exactly been the best timing indicators of a recession.

On a shorter-term basis, though, the recent declines in the NFIB optimism index are notable in the fact that this month’s reading is now the lowest since November 2016. In other words, nearly all of the boost in small business sentiment since the 2016 election has worn off. That right there is probably the number one reason the shutdown ended in late January!

Start a two-week free trial to Bespoke Premium to see today’s full Morning Lineup report. You’ll receive it in your inbox each morning an hour before the open to get your trading day started.
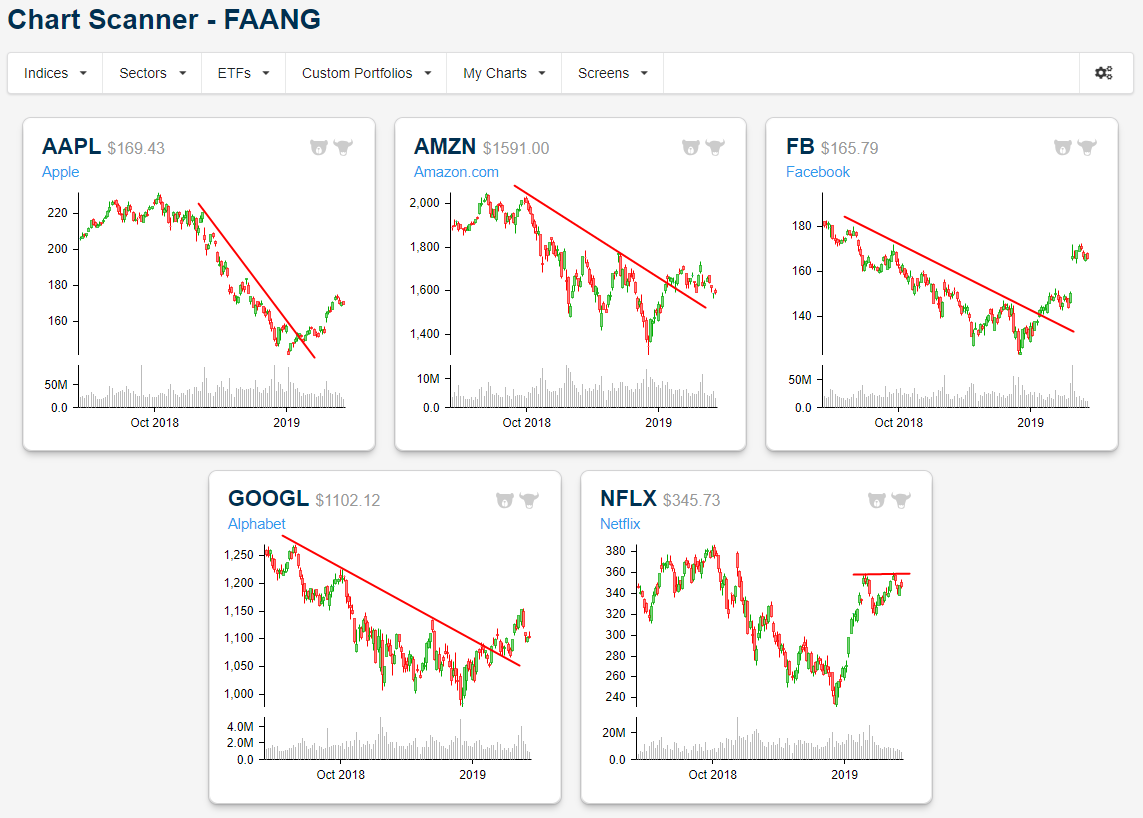
FAANG Chart Update — AAPL, AMZN, FB, GOOGL, NFLX
Below is an updated look at the near-term chart patterns for the five “FAANG” stocks — AAPL, AMZN, FB, GOOGL, and NFLX. All five have broken their Q4 downtrends, but none are very close to making new 52-week highs even after huge rallies off of their lows. If you’d like to see a lot of charts in one place for easy analysis, try our unique Chart Scanner tool. You can build custom portfolios and even tag charts as bullish or bearish so that you can track your calls over time. The Chart Scanner is part of our member area, which you can access with a 14-day free trial today.