Chart of the Day: Tech Hardware, Led By Apple, Looks Positive
Fixed Income Weekly – 2/27/19
Searching for ways to better understand the fixed income space or looking for actionable ideals in this asset class? Bespoke’s Fixed Income Weekly provides an update on rates and credit every Wednesday. We start off with a fresh piece of analysis driven by what’s in the headlines or driving the market in a given week. We then provide charts of how US Treasury futures and rates are trading, before moving on to a summary of recent fixed income ETF performance, short-term interest rates including money market funds, and a trade idea. We summarize changes and recent developments for a variety of yield curves (UST, bund, Eurodollar, US breakeven inflation and Bespoke’s Global Yield Curve) before finishing with a review of recent UST yield curve changes, spread changes for major credit products and international bonds, and 1 year return profiles for a cross section of the fixed income world.
In this week’s report we review market pricing for global central bank action over the next few years.

Our Fixed Income Weekly helps investors stay on top of fixed income markets and gain new perspective on the developments in interest rates. You can sign up for a Bespoke research trial below to see this week’s report and everything else Bespoke publishes free for the next two weeks!
Click here and start a 14-day free trial to Bespoke Institutional to see our newest Fixed Income Weekly now!
Bespoke’s Global Macro Dashboard — 2/27/19
Bespoke’s Global Macro Dashboard is a high-level summary of 22 major economies from around the world. For each country, we provide charts of local equity market prices, relative performance versus global equities, price to earnings ratios, dividend yields, economic growth, unemployment, retail sales and industrial production growth, inflation, money supply, spot FX performance versus the dollar, policy rate, and ten year local government bond yield interest rates. The report is intended as a tool for both reference and idea generation. It’s clients’ first stop for basic background info on how a given economy is performing, and what issues are driving the narrative for that economy. The dashboard helps you get up to speed on and keep track of the basics for the most important economies around the world, informing starting points for further research and risk management. It’s published weekly every Wednesday at the Bespoke Institutional membership level.
You can access our Global Macro Dashboard by starting a 14-day free trial to Bespoke Institutional now!

Morning Lineup – Decisions, Decisions, Decisions
Just like the opening days of the NCAA basketball tournament, today is the kind of day when it pays to have more than one TV or at the very least, a DVR. With President Trump meeting Kim Jong Un, Fed Chair Powell set to resume testimony on Capitol Hill, and former Trump lawyer Michael Cohen also set to testify, who needs Netflix? Not only that, but there’s also a healthy slug of economic data to digest.
Stocks are poised to open lower but since declines early in the European session, S&P 500 futures have edged a bit higher and are currently pointing to a decline of just about 30 bps at the open. The dollar is down for the fourth day in a row and 8th of the last 10 days. Read all about overnight events and this morning’s news in today’s Morning Lineup.
Bespoke Morning Lineup – 2/27/19
Software had been a leading area of the market leading up to the September highs, and the sector pulled back just as much as the broader market during the Q4 sell-off. The rally back, though, has been much stronger. Just yesterday, the group traded within two points of its all-time high from 2018. This particular group isn’t the same as the Software and Services group, which contains many of the highest fliers in the sector, but instead, it is made up of the major players in the space including Microsoft (MSFT), Oracle (ORCL), Adobe (ADBE), Salesforce (CRM), etc. Nevertheless, if this group is trading back at new highs, it bodes well for the overall growth trade and broader market in general.

Meanwhile, semis continue to hold up as well. While not as strong as the software group, it continues to outperform as it attempts to remain above its downtrend from the highs in the first half of 2018.

Start a two-week free trial to Bespoke Premium to see today’s full Morning Lineup report. You’ll receive it in your inbox each morning an hour before the open to get your trading day started.

The Closer — Resistance Ramp, Powell In The Senate, 5 Fed, Housing Confidence — 2/26/19
Log-in here if you’re a member with access to the Closer.
Looking for deeper insight on markets? In tonight’s Closer sent to Bespoke Institutional clients, today’s price action gave some support to our observation yesterday that equities were running out of steam, we provide an updated look at the technicals of the S&P 500 before recapping Fed Chair Powell’s first day of testimonies on Capitol Hill. Turing to what was a busy day in economic data, we take a look at our Five Fed Manufacturing Index with the addition of the Richmond and Dallas Feds’ inputs, what the Conference Board’s data is predicting for the unemployment rate, and finally, the awful print of housing construction data released today.

See today’s post-market Closer and everything else Bespoke publishes by starting a 14-day free trial to Bespoke Institutional today!
Chart of the Day: Tax Policy Weighs On Housing
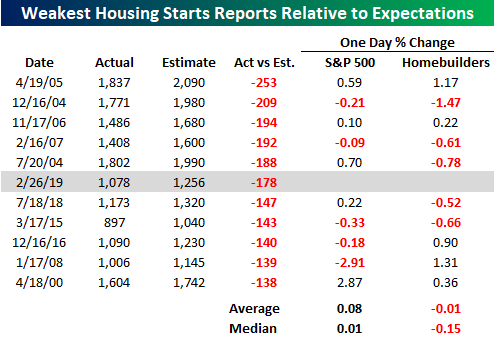
Weakest Housing Starts Relative to Expectations in 12 Years
Now that was a bad Housing Starts report! Just like the recent delayed report on Retail Sales, it may have been better if the finally released report on Housing Starts for the month of December was just swept under the rug. While economists were expecting the headline print to come in at a SAAR level of 1.256 million, the actual reported number came in at 1.078 million, missing expectations by 178K. Using our Economic Indicator Database, we found that there have only been five other monthly Housing Starts reports that missed expectations by a wider amount than the December print with the most recent occurring 12 years ago in 2007!
The table below lists the ten largest prior misses relative to expectations in the monthly Housing Starts report going back to 1998. For each instance, we also include the performance of the S&P 500 and the S&P 500 homebuilder group on the day of the report. While you would expect pretty substantial weakness following a miss of such magnitude, the results are pretty much mixed. Both the S&P 500 and the homebuilders were each up on the day in five instances and down on the day in the other five. In the case of the S&P 500, the bias was ever so slightly to the upside, while for the homebuilders the bias was slightly to the downside.
Morning Lineup – Cautious Tone Ahead of Powell Testimony
What happened in December? Between the delayed December Retail Sales report released earlier this month and this morning’s report on Housing Starts, either the economy hit a cliff or whoever was responsible for tabulating the data while the Federal government was shutdown needs to brush up on their calculations. Today’s report on Housing Starts came in at SAAR of 1.078 million, which was 178K below the consensus forecast of 1.256 million. Looking through our Economic Indicator Database, there has not been that big of a miss in Housing Starts relative to expectations in 12 years! It wasn’t all bad news, though, Building Permits came in better than expected. Besides this morning’s already released data, there’s still a lot on the schedule today, so read all about not only them but also overnight events around the world and this morning’s news in today’s Morning Lineup.
Bespoke Morning Lineup – 2/26/19
Yesterday, we noted the fact that the Shanghai Composite was bumping right up against a very long term downtrend after its 5%+ gain to kick off the week. Overnight, the index rallied higher in the morning but gave it all back throughout the trading day and closed with a decline of just over half of a percent. So, we’re going to have to wait at least another day (and likely more) before that downtrend gets taken out.
Another downtrend that’s provided pretty formidable resistance recently is the short-term downtrend in long-term US Treasury yields. At both the 10 and 30 year maturities, yields just can’t seem to increase the way so many have been calling for. In the case of the 10-year, yields bounced off the early January lows but quickly ran out of steam just shy of resistance at the 2.8% level, and since then have been trending lower right below the 50-DMA. For the 30-year it’s a similar story as the 50-DMA acts as a ceiling and the current yield of 3.02% is just 14 bps above the low print from early January.


Start a two-week free trial to Bespoke Premium to see today’s full Morning Lineup report. You’ll receive it in your inbox each morning an hour before the open to get your trading day started.
The Closer — Reversal At Resistance, Trade Troubles — 2/25/19
Log-in here if you’re a member with access to the Closer.
Looking for deeper insight on markets? In tonight’s Closer sent to Bespoke Institutional clients, with the S&P 500 failing to hold above resistance and given overbought levels, we provide the near term prospects of the index. Moving on to economic data, we focus tonight on the declines in world trade volumes as seen through CPB’s data released today. We give some perspectives on the outlook of trade given what leading indicators and hard data have to say. We finish on a brighter note of stronger global industrial production also via the CPB.
See today’s post-market Closer and everything else Bespoke publishes by starting a 14-day free trial to Bespoke Institutional today!
The Biggest Winners and Losers on Earnings This Season
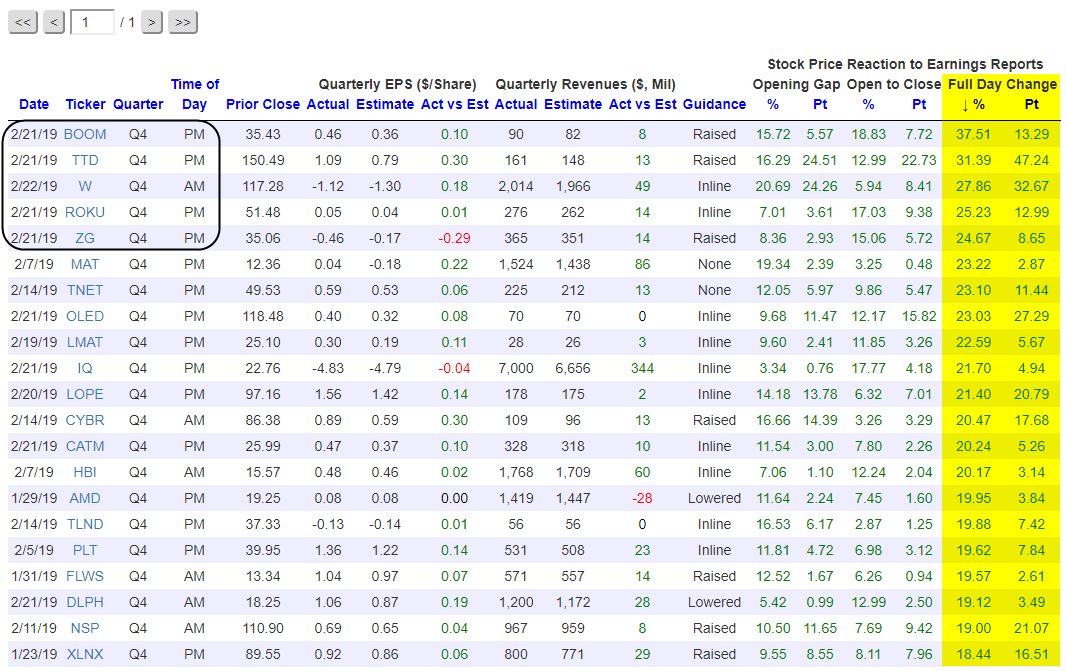
Last Friday turned out to be a monster day for a handful of companies that reported earnings either that morning or the night before. In fact, of stocks trading greater than $10/share, the five best performers on their Q4 2018 earnings reaction days this earnings season (companies reporting between January 10th and February 22nd) all occurred last Friday.
Pulled from our popular Earnings Explorer tool, below we show a list of this season’s best-performing stocks on earnings. Again, to make the list, the stock had to be trading for more than $10/share at the close prior to its earnings report. Metalworking company Dynamic Materials (BOOM) ranks first with a gain of 37.51% last Friday. Media marketing company Trade Desk (TTD) ranks 2nd with a gain of 31.39%, followed by Wayfair (W) at +27.86%, Roku (ROKU) at +25.23%, and Zillow Group (ZG) at +24.67%.
The best performing stock on earnings that didn’t report last Friday was toy-maker Mattel (MAT), which gained 23.22% on February 8th following its report after the close on the 7th. Other notables on the list of biggest winners this earnings season include Advanced Micro (AMD), 1-800-Flowers (FLWS), and Xilinx (XLNX).
Along with seeing the 5 best performers on earnings this season, last Friday also saw the 1st and 3rd worst performers. Online shipping company Stamps.com (STMP) reported earnings after the close on Thursday the 21st, and the company also announced that it was ending its exclusive partnership with the US Postal Service. Investors sold first and asked questions later. STMP lost 57.77% of its value on Friday, which was nearly 30 percentage points more than the 2nd biggest loser this earnings season. Third on the list of biggest losers this earnings season is Kraft Heinz (KHC), which dropped 27.46% on Friday.
There was nothing special about last Friday that would have caused out-sized gains or losses for companies reporting earnings, but there were certainly a lot of fireworks!
Try out our unique investor tools with a free trial to Bespoke Interactive!
