Technology vs. Utilities
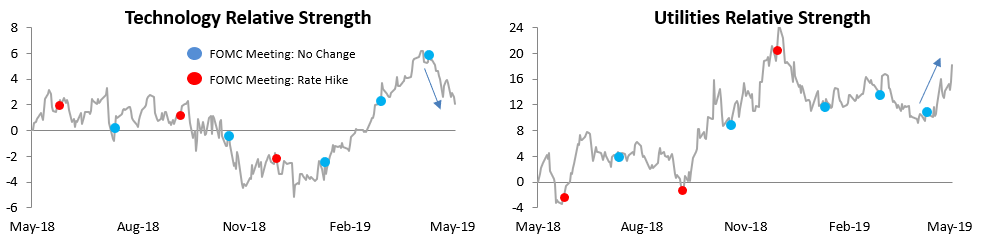
Below are relative strength charts (vs. the S&P 500) for the Technology and Utilities sectors. In the chart, when the line is rising, the sector is outperforming the S&P 500, and vice versa for a falling line. In each chart we provide dots for days that the FOMC made a rate decision. Blue dots are days when the Fed left rates unchanged, while red dots are days when the Fed hiked rates.
While the Fed kept rates unchanged at its most recent meeting, it marked a key turning point for the cyclical Tech sector and the defensive Utilities sector. Since the last FOMC meeting, Tech has seen its relative strength plummet as investors have shifted quite dramatically into defensives like Utilities.
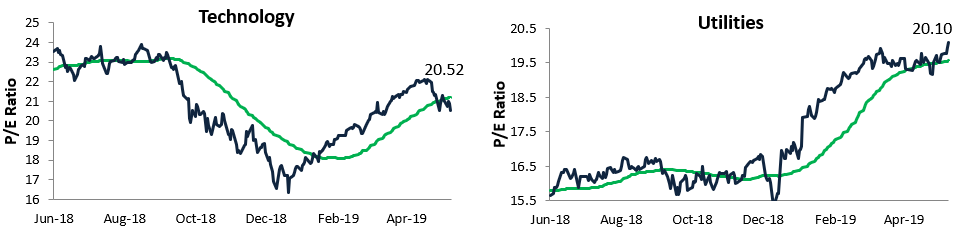
The rally for Utilities and decline for Technology have done a number on valuations for the two sectors, to the point where their trailing 12-month P/E ratios are nearly the same. Tech’s P/E currently stands at 20.52, well below the reading near 24 it had in late 2018. Utilities has seen its P/E balloon above 20 up to 20.10 as of this morning, which is nearly 5 points higher than it was at the end of 2018. When a no-growth sector like Utilities has a P/E that’s similar to a growth-oriented sector like Tech, it doesn’t say much about the confidence of investors.
Morning Lineup – 90 Up, 184 To Go
This just hasn’t been a month for months or Prime Ministers with the name May. This May, stock markets around the world are on pace for their worst month of the year, and this morning UK Prime Minister Theresa May has finally given in and announced her resignation effective June 7th. Thankfully, June is right around the corner. While it’s been a pretty bad May, US equities are doing their best this morning to finish off the week on a positive note as Dow futures are indicating a positive open of +90 points (down from earlier highs) which would mean that it only needs another 184 points to get back to even for the week. While it’s a full day of trading, with the holiday weekend coming up, you can bet that a lot of trading desks will start to clear out early today.
Make sure to check out today’s Morning Lineup for a recap of all the important overnight and morning events from around the world. Included in today’s report is our take on Theresa May’s resignation, as well as an analysis of the short-term trading action in European equities.

You don’t need us to tell you that investors have been rotating into defensive sectors lately, but we have a great illustration of it for you. The chart below shows the relative strength of the S&P 500 Technology sector and compares it to the relative strength of defensive sectors like Utilities, Consumer Staples, and Health Care. In the chart, rising lines indicate periods where the sector outperformed the S&P 500 and vice versa.
For much of 2019, Technology was leading the market higher, while all three defensive sectors lagged. In late April, though, it was like a switch went off as trade war fears intensified. Investors quickly started rotating out of Technology and into the defensives, which have surged relative to the market.

Start a two-week free trial to Bespoke Premium to see today’s full Morning Lineup report. You’ll receive it in your inbox each morning an hour before the open to get your trading day started.
B.I.G. Tips – Stocks With International Exposure Crushed
We’ve just published a B.I.G. Tips report that provides a glance at the disparity between US stocks with and without heavy international exposure.
Headlines covering the ongoing trade dispute remain a leading catalyst for market action this month. Given the ramping up of these concerns, it can be reasoned that domestics would begin to outperform internationals, and so far, we have seen exactly this. To evaluate, we break up the S&P 500 into deciles based on international revenue exposure. We also show a decile analysis for May performance based on dividend yield and YTD change through April in addition to the best and worst performing stocks in May. To read this report and access all of our other reports, start a two-week free trial to Bespoke Premium!

The Closer – FANG & Oil Cruise Lower, Domestic Imports, Manufacturing, Homes – 5/23/19
Log-in here if you’re a member with access to the Closer.
Looking for deeper insight on markets? In tonight’s Closer sent to Bespoke Institutional clients, we recap today’s price action with a look at the steep declines of FANG+ and crude oil. We also show forward performance of oil following similar declines. As tariffs have been on the receiving end of the finger pointing for recent performance, we then take a look at how import heavy companies have done. Turning to macro data, we update our Five Fed Manufacturing composite with the addition of the KC Fed’s index. We use this in combination with today’s flash PMI to evaluate the US manufacturing picture. We finish tonight with a look at today’s release of New Home Sales data.

See today’s post-market Closer and everything else Bespoke publishes by starting a 14-day free trial to Bespoke Institutional today!
Bespoke’s Sector Snapshot — 5/23/19
We’ve just released our weekly Sector Snapshot report (see a sample here) for Bespoke Premium and Bespoke Institutional members. Please log-in here to view the report if you’re already a member. If you’re not yet a subscriber and would like to see the report, please start a two-week free trial to Bespoke Premium now.
In this week’s Sector Snapshot, we note a weakening Tech sector as Utilities rally. As shown below, 75% of Utilities stocks are above their 50-day moving averages, which is the highest reading for any sector.
To gain access to the report, please start a two-week free trial to our Bespoke Premium package now. Here’s a breakdown of the products you’ll receive.
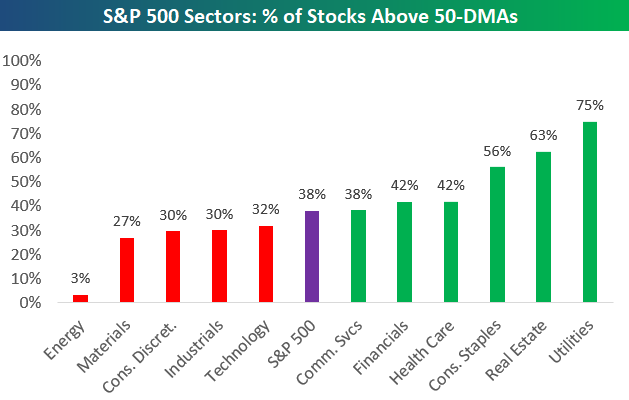
Chart of the Day: Pessimistic AAII Points to Positive Performance
B.I.G. Tips – Market and Economic Sentiment Diverge
We’ve just published a B.I.G. Tips report that provides a full update of our composite economic and market sentiment charts that are highlighted in our annual Bespoke Report each year.
While the stock market typically follows the economy, one would expect that sentiment towards the two would be similar. As we have seen over time, though, that is far from always the case. Our composite indicators take a number of different economic and stock market sentiment indicators and combines them into one key reading of sentiment. Currently, both of these indicators are showing entirely different outlooks. To read our newest report and see the latest updates to our sentiment indices, start a two-week free trial to Bespoke Premium!
Jobless Claims Hold
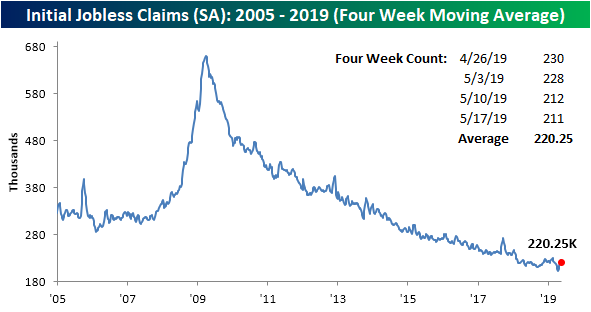
Weekly jobless claims released this morning came in at 211K, which was below expectations of 215K and the 212K reading last week. The seasonally adjusted number has now spent 71 straight weeks below 250K and 220 consecutive weeks below 300K. Start a two-week free trial to Bespoke Institutional to access our interactive economic indicators monitor and much more.
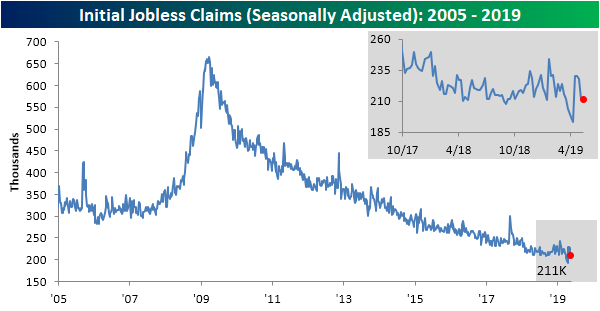
After rising to 225K last week, the four-week moving average also saw a modest decline. The moving average fell to exactly where it was at the start of the month (220.3K). This comes as one of the recent highs of 230K has rolled off of the average. Turning to next week, assuming we see a similar print to this week, another data point of 230K will fall out of the average, so we may see another drop in the four-week average as well.
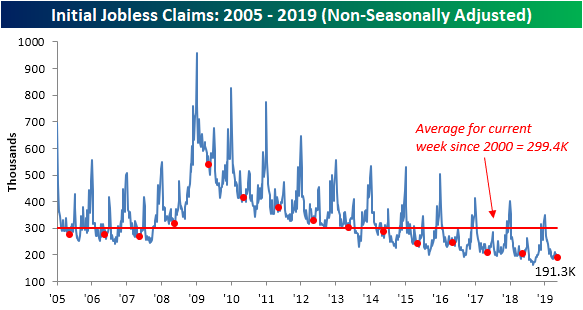
As per usual, non-seasonally adjusted (NSA) jobless claims came in well below the average for the current week since 2000. At 191.3K, NSA claims are over 100K below this average. This week’s print is also the lowest for the current week of the year of the current cycle and going back to at least 2000. With this new low for the current week of the year, the past couple of weeks’ releases have been a welcome change from the YoY increases in the NSA data that has been frequently observed this year.
Overall, the data has been somewhat mixed recently. Though initial claims more or less held steady this week, continuing claims saw the opposite result as they rose from the previous week and missed forecasts with a print of 1,676K (1,666K expected). While initial claims appear to still be chugging along just fine (YoY increases aside), continuing claims still have not made a new low since last October. That is not necessarily a horrendous thing for either considering the data has also not rocketed higher by any stretch, but it does confirm that the pace in claims falling has somewhat slowed relative to previous years.
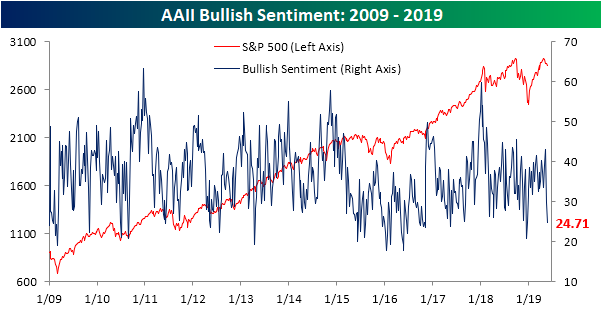
New Low For Bullish Sentiment
Trade headlines have continued to have a negative impact on stock prices, and in turn sentiment levels, over the past week. The AAII investor sentiment survey saw bullish sentiment decline sharply once again this week falling to 24.71% compared to 29.82% last week. To think that just two weeks ago bullish sentiment was at 43.12%, which was the highest reading of the year. Falling 18.41% from this recent high, the current decline is the largest two-week drop in bullish sentiment since 6/6/13 when it fell 19.5% over the two previous weeks. Start a two-week free trial to Bespoke Institutional to access our interactive economic indicators monitor and much more.
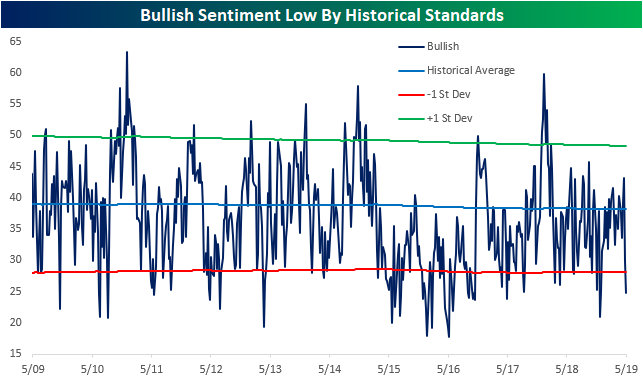
But this is not necessarily all bad news from a contrarian perspective. As shown in the chart below, this week’s reading of 24.71% is well below the historical average of 38.21%. In fact, it is over 1 standard deviation below it, something that can be considered a bit extreme and raising expectations for some type of mean reversion. When bullish sentiment reaches an extreme low by historical standards, forward equity market performance has typically been stronger than average. The last time survey respondents showed this little optimism was in late December of last year; right around the time of the market bottom.
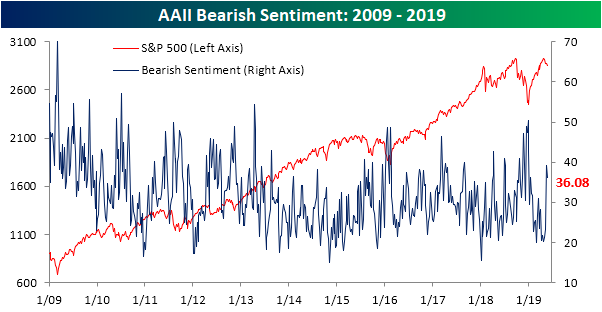
Surprisingly, while there was this development in bullish sentiment, bearish sentiment actually fell to 36.08% versus 39.3% last week. So while still elevated from where it has been for much of this year as the market has rallied, bearish sentiment is not reaching new highs. It is also still above its historical average but not to an extreme degree.
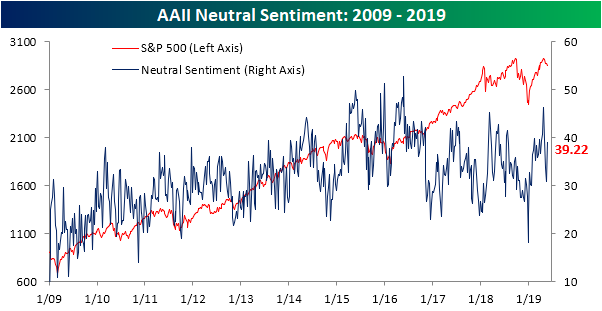
Neutral sentiment took from the losses in the bullish and bearish camps as it rose to 39.22%. While this sounds high, there was actually a slightly higher reading at the beginning of the month and this brings the neutral reading off of its recent lows and more in line with what has been observed for most of this year.
Morning Lineup – More Bad Trade Headlines
The back and forth action of the market lately in response to trade headlines related to China is really getting tiresome. Today, the narrative is negative as futures have been trending lower all night and into this morning. While we’ve seen a small bounce since 6:00 AM NY time (when things started to head south yesterday) we’re still deep in hole relative to yesterday’s close. Jobless Claims were just released and came in slightly lower than expected (211K vs 215K).
Be sure to check out today’s report for a recap of all the US and major European earnings reports overnight, the latest releases of flash PMIs for May, and some European data that was actually positive. How about that!
We mentioned that the constant whipping around of the markets has become tiresome. To illustrate just how much US equities have been getting tossed around lately based on overnight headlines, the chart below shows the 20-trading day average of the opening gap for the S&P 500 ETF (SPY). Including today’s weakness, over the last 20 trading days, SPY has averaged an opening gap to the downside of 0.36%. As shown in the chart, this hasn’t happened too often in the period since the financial crisis. In fact, the last time it occurred was in August 2015 (China issues again) and before that 2011 (US debt downgrade)!

While the S&P 500’s opening print has tended to be extremely weak over the last four weeks, investors have spent most of the trading day buying the weakness. As shown in the chart below, the S&P 500’s average change from the open to close has been a gain of 0.22%. That hasn’t been enough to erase the opening losses, but it has managed to keep the market’s declines in check.

Start a two-week free trial to Bespoke Premium to see today’s full Morning Lineup report. You’ll receive it in your inbox each morning an hour before the open to get your trading day started.