95% Gone
Back in the fourth quarter of 2016, in the immediate aftermath of the 2016 Election, sentiment towards manufacturing in the US surged. Right before the election in October 2016, the ISM Manufacturing index was at 51.7 and eventually rallied all the way to a peak of 60.8 in August 2018. For the last nine months, though, manufacturing sentiment has been falling off a cliff as the impact of tariffs (both actual and threatened) put a damper on sentiment. In the latest monthly ISM Manufacturing survey, the headline index dropped from 52.8 down to 52.1 to its lowest reading since October 2016. With this month’s decline, now, 95% of the post-election gains have been re-traced. Start a two-week free trial to Bespoke Institutional to access all of our research and interactive tools.

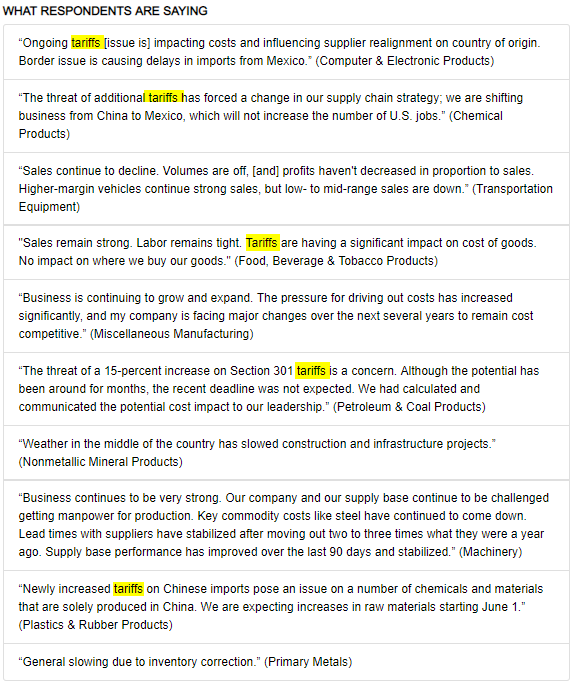
As just an example of how tariffs are impacting sentiment, take a look at the commentary section of this month’s report. Of the nine comments included in the section, five cited tariffs as an issue. The second comment was especially notable where a respondent from the Chemical Products industry said that tariffs in imports “…will not increase the number of U.S. jobs.”
As far as the breadth of this month’s report is concerned, the sub-components were evenly split between gains and losses relative to April’s levels, but the majority were down relative to where they stood last year at this time. The only two that showed increases were Business Inventories and Customer Inventories. On the downside, Production, New Orders, Backlog Orders, Supplier Deliveries, and Prices Paid all saw double-digit declines. Prices Paid has been a real notable decliner, dropping more than 25 points from where it was last year!

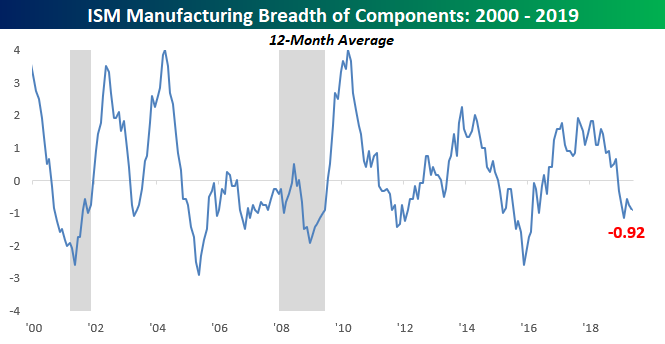
Looking at how breadth in the individual components of the ISM Manufacturing report have trended over time, the chart below shows the net number of components showing m/m increases on a 12-month average basis. Through May, the 12 month average for the Manufacturing sector was -0.92, which surprisingly isn’t the weakest reading we have seen in the last few months. At least the pace of decline isn’t still accelerating.
Dow Losing Streaks; Market Internals
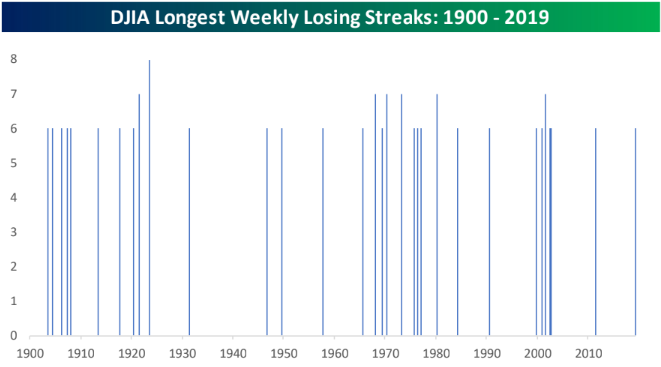
The Dow Jones Industrial Average is currently riding a six-week losing streak for the first time in more than five years. In last week’s Bespoke Report newsletter (read it here), we noted the chart below which shows the longest weekly losing streaks for the Dow since 1900. As you can see, it’s very rare that we get to seven, with only seven prior occurrences. And there has only been one eight-week losing streak for the Dow since 1900! Start a two-week free trial to Bespoke Institutional to access all of our research and interactive tools.
As you can imagine, a six-week losing streak for the stock market does a number on internal indicators, some of which are highlighted below. This is a snippet from our Morning Lineup sent to clients each morning, so if you’re interested in staying up-to-date on these readings, you can find them in this report.
As shown in the top left chart, the S&P 500 has moved into extreme oversold territory relative to its 50-day moving average. The second chart on the left shows the percentage of stocks in the S&P that are overbought vs. oversold. While not at the extremes we saw at the end of 2018, the percentage of oversold stocks is definitely elevated right now at 52.8%.
The bottom left chart shows the relative performance of stocks versus bonds over the last year. The recent rally for Treasuries coupled with the decline for stocks has left stocks underperforming bonds over the last 12 months.
On the right-hand side of the snapshot, we first provide a number of additional market metrics, with the arrow signifying the one-week change of each reading. The second section on the right shows sector trading range levels, and here you can see that every sector except Utilities is currently oversold. Finally, the third table on the right shows that commodities are extremely oversold while Treasuries are now extremely overbought.

Morning Lineup – Still Cloudy on the Tariff Front
There wasn’t a whole lot of news in either direction over the weekend over the escalating tariff situation between the US, China, and the ever-growing list of other countries that the current administration has threatened. As a result, US futures are moving in the path of least resistance (lower), while rates are lower. That being said, yields and equity futures are off their overnight lows.
It’s a big day for economic data to kick off the week and it’s going to be a busy week in terms of Fed speakers, so if the FOMC was looking for an opportunity to send a message to the markets that they are incorrect in pricing an 88% chance of a cut by September, now is the time to do it.
Please click the link below to read today’s Bespoke Morning Lineup for more of our thoughts on the latest from the latest international manufacturing PMI readings for the month of May as well as an early look how European auto sales are shaping up for May.

With the continued weakness in the equity market last week, the percentage of oversold US stocks is really starting to pile up. As shown in the chart below, through Friday’s close, nearly 40% of all S&P 500 stocks were trading more than one standard deviation below their 50-DMA. The last time we saw a reading this negative was on January 3rd.

Start a two-week free trial to Bespoke Premium to see today’s full Morning Lineup report. You’ll receive it in your inbox each morning an hour before the open to get your trading day started.
Bespoke Brunch Reads: 6/2/19
Welcome to Bespoke Brunch Reads — a linkfest of the favorite things we read over the past week. The links are mostly market related, but there are some other interesting subjects covered as well. We hope you enjoy the food for thought as a supplement to the research we provide you during the week.
While you’re here, join Bespoke Premium for 3 months for just $95 with our 2019 Annual Outlook special offer.
Food
Moneyball for Cattle Is Creating an American Steak Renaissance by Lydia Mulvaney and Michael Hirtzer (Bloomberg)
Cheap, accessible genomic testing is reducing uncertainty and raising quality in the top tier of US beef herds. [Link; soft paywall]
6 Hot Takes About the Right Way to Make a Peanut Butter and Jelly Sandwich (Bon Appétit)
A compendium of analysis on the right way to make the most time-honored of American snacks, but no consistent result: smooth, crunchy, bread type, jam flavor… [Link]
Chinese Repression
Four Is Forbidden by Yangyang Cheng (ChinaFile)
A remarkable narrative about growing up in a society where the great traumas are suppressed in the name of political expediency; noteworthy as we approach the anniversary of the massacre at Tiananmen Square in early June. [Link]
‘If I disappear’: Chinese students make farewell messages amid crackdowns over labor activism by Gerry Shih (WaPo)
In the height of ironies, the Chinese Communist Party has been detaining and disappearing Marxist students who are pushing back against inequality and corruption in the ostensibly communist nation. [Link; soft paywall]
Labor Markets
Child Care Is Expensive, But Providers Themselves Struggle To Get By by Elly Yu and Martin Austermuhle (American University/WAMU)
While childcare costs have spiraled dramatically higher and out of reach of many working families, the actual workers who keep an eye on the little ones haven’t seen their extremely low wages push much higher, an apparent conundrum. [Link]
Google’s Shadow Work Force: Temps Who Outnumber Full-Time Employees by Daisuke Wakabayashi (NYT)
The majority of people who work “at” Google are temporary employees or contractors, making full-time employment status and the benefits that come with it nothing but a dream for most of the people who keep the company running. [Link; soft paywall]
Politics
What Republicans And Democrats Are Doing In The States Where They Have Total Power by Perry Bacon Jr (FiveThirtyEight)
The concept of “revealed preference” is a useful tool from economics; forget what someone says they’ll do, what will they actually do? This article attempts to illustrate revealed preference of both parties by looking at state-level policies put into place over the last couple years when either party has full control. [Link]
Rep. Josh Gottheimer Is A Really, Really Terrible Boss, Former Staffers Say by Ryan Grim (The Intercept)
An amusing set of anecdotes related to a run-of-the-mill meeting with constituents held by a New Jersey Democrat with some extreme sensitivity to his public image. [Link]
Where Democrats And Republicans Live In Your City by Rachael Dottle (FiveThirtyEight)
The great sort has created a geographic fissure between red and blue states, as well as between rural and urban areas. But there are also large splits within cities that create plenty of local polarization within metropolitan areas. [Link]
Higher Education
UIC to offer in-state tuition to students from any of the 573 tribal nations in US (University of Illinois at Chicago)
In a first (as far as we are aware) the University of Illinois at Chicago is offering in-state tuition discounts to students from any of the 573 American Indian and Alaska Native tribal nations scattered around the country. [Link]
The Books of College Libraries Are Turning Into Wallpaper by Dan Cohen (The Atlantic)
While students still expect libraries to be full of books, most of that expectation is driven by aesthetics: the Yale Library has seen a 64% decline in book checkouts over the past decade. [Link]
Public Health
Measles Cases Reach Highest Level in More Than 25 Years, C.D.C. Says by Liam Stack (NYT)
Thanks to misinformation and the following decline in vaccination rates, measles is making a massive comeback; decisions to avoid vaccination has put thousands of children at risk of a disease that widespread vaccination had at one point all but eliminated. [Link; soft paywall]
Conspicuous Consumption
Someone Bought a $400,000 Diamond Ring at Costco by Matthew Boyle (Bloomberg)
In its report on quarterly results this week, Costco management noted a “significant diamond ring purchase, in the $400,000 range”. [Link]
“Salvator Mundi” was pulled from the Louvre’s blockbuster Leonardo da Vinci show. by Nate Freeman (Artsy)
A massive Leonardo da Vinci show is set to open in Paris this October, but curators are excluding a work sold for $450mm at Christies in November of 2017. The furor relates to who actually painted the work, either the master himself or other painters studying under him. [Link]
Trash
Treated like trash: south-east Asia vows to return mountains of rubbish from west by Hannah Ellis-Petersen (The Guardian)
Developed countries have been shipping massive volumes of trash to Southeast Asia, with plastics and discarded technology piling up in the Philippines, Indonesia, Vietnam, and Malaysia. National governments are starting to get sick of it. [Link]
Don’t Overestimate The ‘Semi’ In Semiautonomous Cars by Alex Davies (Wired)
Semiautonomous driving features can be a problem for consumers because they are inconsistent in terms of features and functionality, creating dangerous gaps between what consumers expect and what cars are designed to do. [Link; soft paywall]
Foreign Relations
The Moment Merkel Realized Trump Changes Everything for Germany by Patrick Donahue (Bloomberg)
A tick-tock detailing the frame of mind for German Chancellor Angela Merkel as she grapples with the failure of the United States in dealing with its long-term allies. That phenomenon will extend beyond the current President’s term as hard-won credibility has been squandered. [Link; auto-playing video, soft paywall]
The Lighter Side
The Kentucky Derby, as Told by the Horses by John Kenney (The New Yorker)
What would horses who run the Kentucky Derby have to say about the race if they were able to tell us what is on their minds? [Link; soft paywall]
Read Bespoke’s most actionable market research by joining Bespoke Premium today! Get started here.
Have a great weekend!
The Bespoke Report – “Tired of Losing”
This week’s Bespoke Report newsletter is now available for members. In this week’s report, we cover the good, the bad, and the downright ugly when it comes to the action for equity markets lately. There’s plenty of ugly to go around like the yield curve and the technical backdrop, but there’s also some good that you may be surprised to see.
We cover everything you need to know as an investor in our weekly newsletter. To read the Bespoke Report and access everything else Bespoke’s research platform has to offer, start a two-week free trial to one of our three membership levels. You won’t be disappointed!

The Closer: End of Week Charts — 5/31/19
Looking for deeper insight on global markets and economics? In tonight’s Closer sent to Bespoke clients, we recap weekly price action in major asset classes, update economic surprise index data for major economies, chart the weekly Commitment of Traders report from the CFTC, and provide our normal nightly update on ETF performance, volume and price movers, and the Bespoke Market Timing Model. We also take a look at the trend in various developed market FX markets.

The Closer is one of our most popular reports, and you can sign up for a free trial below to see it!
See tonight’s Closer by starting a two-week free trial to Bespoke Institutional now!
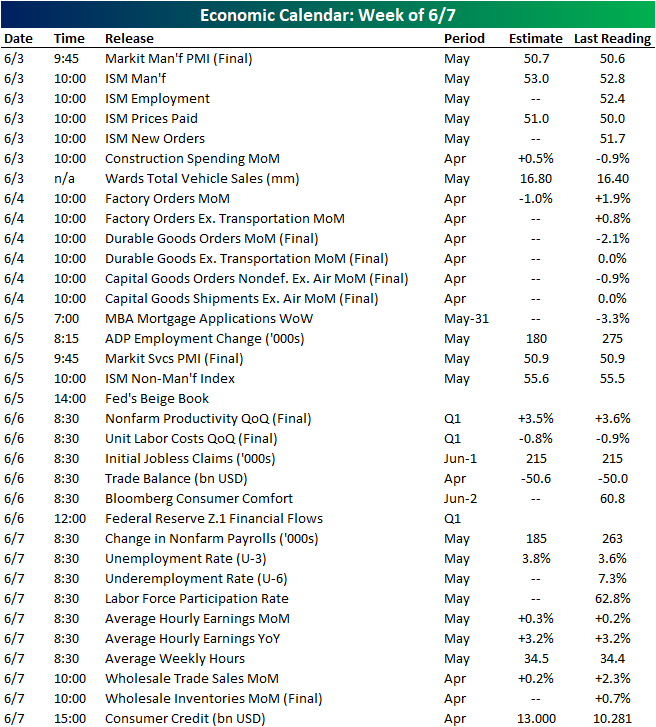
Next Week’s Economic Indicators – 5/31/19
This week’s economic data came in split down the middle with 12 releases coming in worse than the prior period or estimates and another 12 improving. A remaining 3 met expectations or were unchanged from the previous period. We noted this same pattern in our Matrix of Economic Indicators for April. The FHFA’s House Price Purchase Index for the first quarter was the first release of a shortened week coming in unchanged from the previous quarter at 1.1%. Monthly FHFA and Case-Shiller prices also came out on Tuesday with both showing slower home price growth. Later that morning the Conference Board’s readings on Consumer Confidence came in stronger than both forecasts and the April reading. The final release Tuesday, the Dallas Fed’s Manufacturing Activity, disappointed at -5.3 versus expectations of 6.2. On Wednesday, the Richmond Fed’s Manufacturing Activity index also came in below expectations but was stronger than the April reading. The second release of Q1 GDP was revised lower but less than expected with growth for Q1 now sitting at 3.1% QoQ SAAR. While consumption growth was stronger, that came thanks in part to inflation measures falling below estimates. Retail and Inventories grew more than expected in April as seen in their Thursday release. Pending home sales were also notably weak. Friday data was better with Personal Income and Spending numbers both beating estimates. Michigan Sentiment was the final release of the week with a reading of 100.0 versus forecasts of 101.5, both below the 102.4 reported in preliminary data.

With 34 releases, the data slate picks up next week. Monday we will get some important manufacturing data including the final data for May for the Markit PMI and ISM Manufacturing. Revisions for durable goods and the broader factory orders numbers for April will follow up on Tuesday. As next week is the first week of June, on Wednesday ADP will release their employment data for the month of May. This is expected to show fewer jobs created than April. The service portions of Markit PMIs and ISM will also come out Wednesday morning. In addition to the usual Thursday weekly releases, Nonfarm Productivity and Unit Labor Costs for the first quarter are expected. The Employment Situation Report with its Nonfarm Payrolls number will round out the week in economic data on Friday morning.
Bespoke Market Calendar — June 2019
Please click the image below to view our June 2019 market calendar. This calendar includes the S&P 500’s average percentage change and average intraday chart pattern for each trading day during the upcoming month. It also includes market holidays and options expiration dates plus the dates of key economic indicator releases. Start a two-week free trial to one of Bespoke’s three premium research levels.

DJIA Six Week Losing Streaks
Barring a 700+ point rally into the close (hey, anything is possible), the DJIA is on pace for its first six-week losing streak since June 2011 and the 32nd such streak going back to 1900. As of this writing, the DJIA is down 6.46% over the course of this current losing streak, which would go down as the mildest six-week losing streak for the index since June 1976 and the fifth ‘mildest’ six-week losing streak on record. The chart below highlights each of the DJIA’s prior six-week losing streaks since 1900 and shows how much the index declined during each one of them. Start a two-week free trial to Bespoke Institutional to access all of our research and interactive tools.
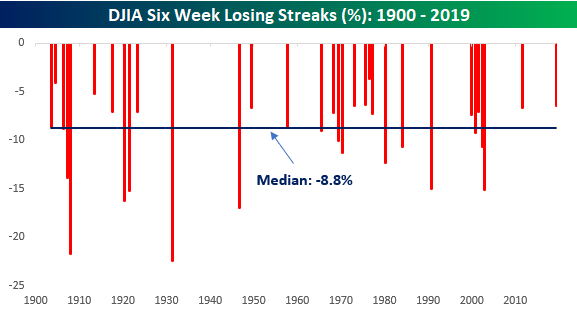
While there have been quite a few six-week losing streaks for the DJIA in its history, it is not common for them to go on into a seventh week. As shown in the chart below, just seven of the DJIA’s 32 prior six-week losing streaks have last seven or more weeks, and a 7-week losing streak stretching to an eighth week is practically unheard of with just one way back in 1923.

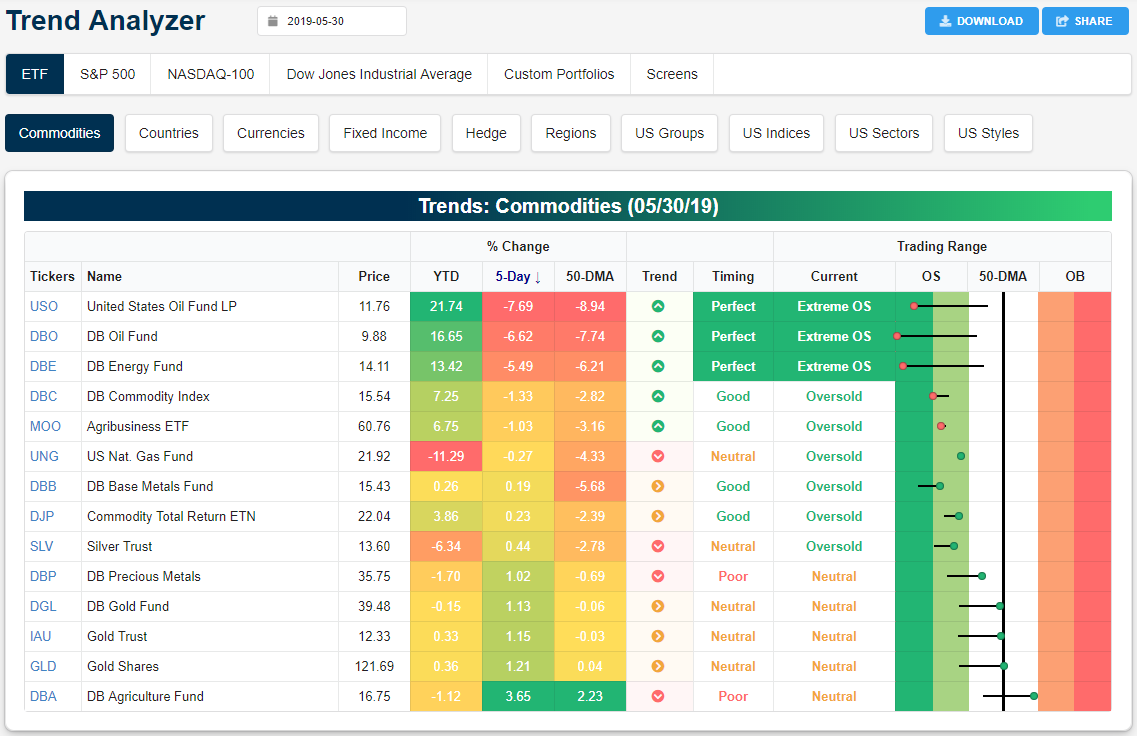
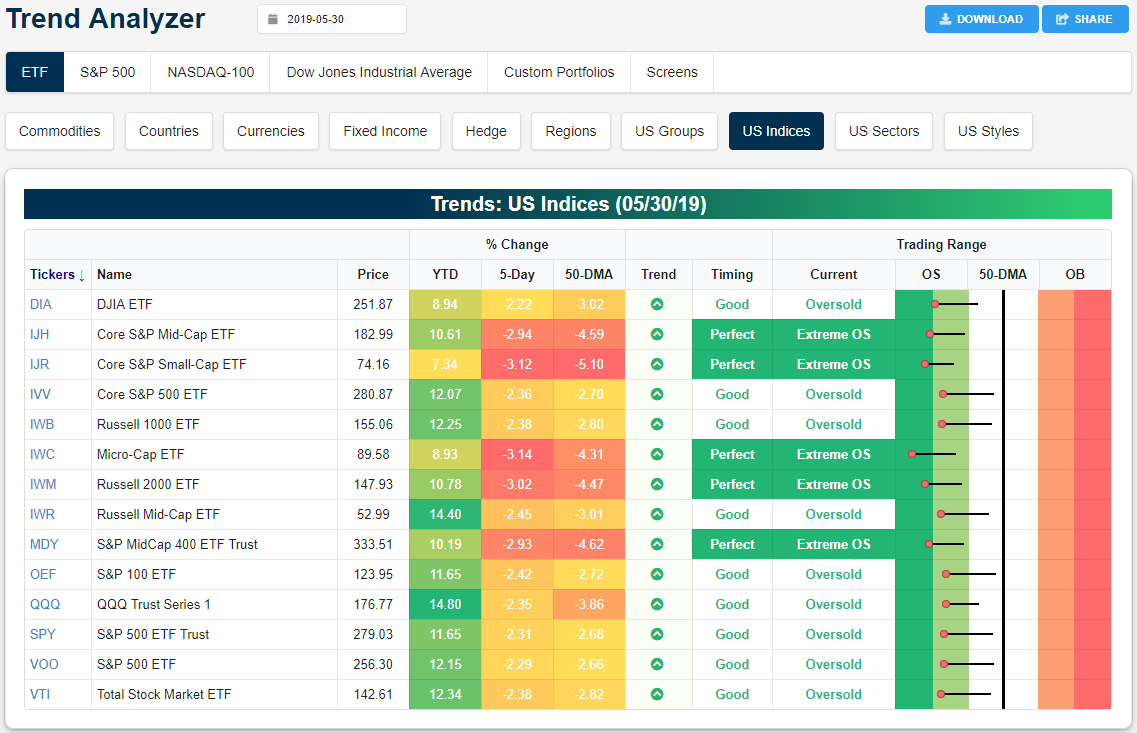
Trend Analyzer – 5/31/19 – Oil Oversold, Metals Move Higher
We mentioned yesterday that half of the major index ETFs were sitting at extremely oversold levels at the start of trading yesterday. Small gains helped to at least lift some of these ETFs off of these levels, but a sizeable gap lower at today’s open brought them right back—if not to a greater degree—into oversold territory. While every major index ETF is sitting on a loss over the past week, small and mid-caps have been handily underperforming. These also are all the ones that are still extremely oversold. The Core S&P Small-Cap ETF (IJR) has seen the worst of these declines down 3.8%. This has also tanked gains for the year as it now has the lowest YTD gain of the group. Start a two-week free trial to Bespoke Institutional to access our interactive economic indicators monitor and much more.
Peeking at commodities, similar to equities, oil has been taking it on the chin. Yesterday alone, in spite of supply data that would have indicated stronger prices, WTI crude futures fell just under 4.5% adding to its second straight week of declines; a total decline of 12.95% in that time. On these declines, Oil ETFs (USO and DBO) and the Energy fund (DBE) have all reached extreme oversold levels whereas they were neutral last week.
Conversely, precious metals ETFs have not been shaken by headlines of China raising tariffs on these commodities. The Precious Metals ETF (DBP) in addition to each of the gold ETFs (GLD, DGL, and IAU) have been some of the best performing commodity ETFs this week. The gold ETFs are hovering just under a half of a percent gain and DBP has seen a bit weaker performance gaining 0.23%. While these have been outperforming most commodities, the Agriculture Fund (DBA) has been doing so to an even greater degree with more than quadruple the gains of the next best performer, Gold Trust (IAU). This move has brought DBA towards the upper end of its long term and persistent downtrend channel. This also means DBA is just outside of overbought territory as well.