
ISM Services Weaker Than Expected
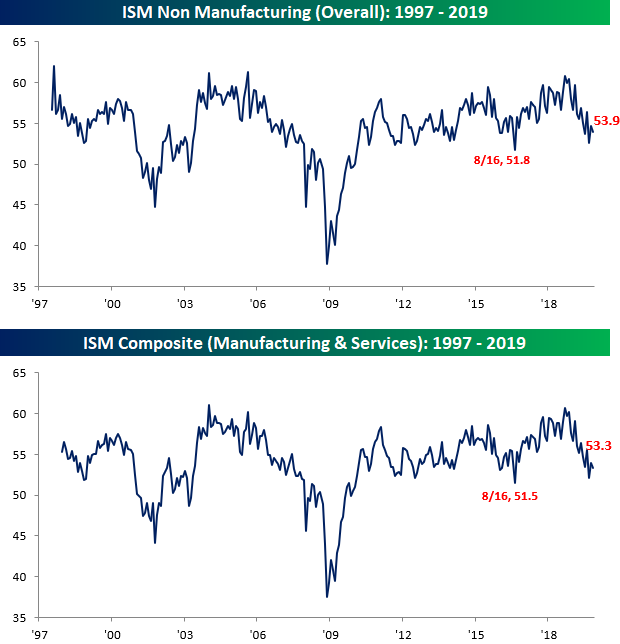
It hasn’t been a great day for US economic data. Less than two hours after the ADP Private Payrolls report missed expectations by around 75K, the November reading in the ISM Services index came in weaker than expected, falling from 54.7 down to 53.9 and below consensus forecasts for a reading of 54.5. Combining this morning’s report with the ISM Manufacturing report from Monday and accounting for each sector’s weight in the overall economy, the November ISM fell from 54.0 down to 53.3.
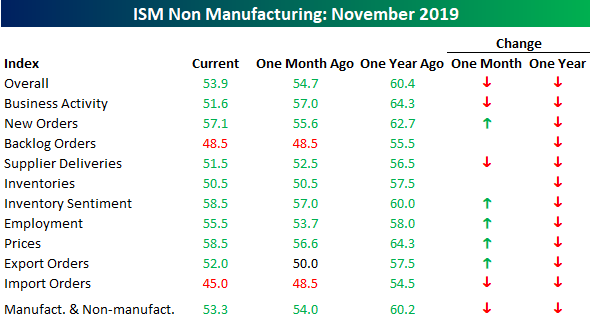
Looking at the internals of this month’s report, the m/m readings were mixed, while the y/y readings were all lower. Relative to October, more components actually saw increases (5) than declines (3), while two were unchanged. Furthermore, we didn’t see any increase in the number of components in contraction mode (below 50). On a y/y basis, not only is every component lower versus last year at this time, but they are down pretty significantly with an average decline of 6.2 points.
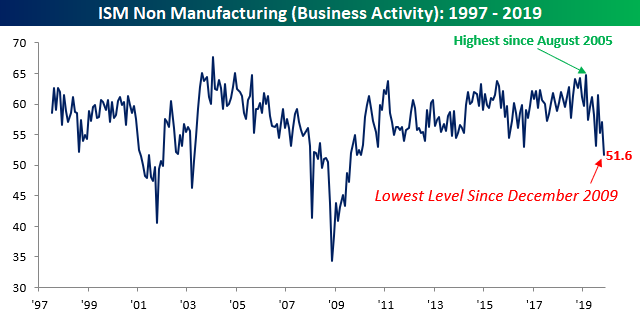
The biggest decliner of them all on a y/y basis is Business Activity. Back in February, this component climbed to its highest level since August 2005. Now, just nine months later, it’s down to its lowest level since December 2009. From a 14-year high to a 10-year low in just nine months. Pretty quick turnaround.
Behind Business Activity, the Imports component of the ISM Services report has also seen a large pullback. After falling from 48.5 down to 45.0, this component is now at its weakest reading since July 2012.

One bright spot in this month’s report, especially with the November Non-Farm Payrolls report coming up on Friday, was the Employment component. With an increase from 53.7 up to 55.5, it saw the largest two-month gain since January 2018. Start a two-week free trial to Bespoke Institutional to access our research reports, interactive tools, and more.

Bespoke’s Global Macro Dashboard — 12/4/19
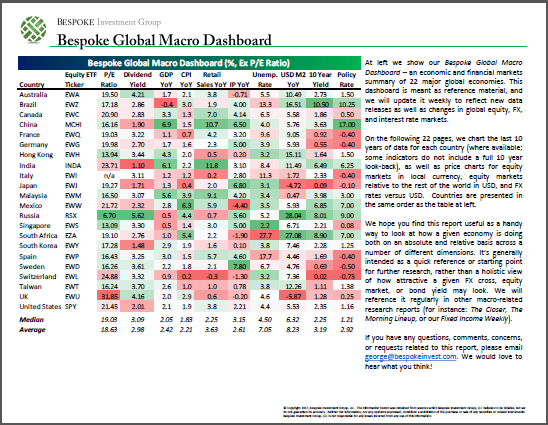
Bespoke’s Global Macro Dashboard is a high-level summary of 22 major economies from around the world. For each country, we provide charts of local equity market prices, relative performance versus global equities, price to earnings ratios, dividend yields, economic growth, unemployment, retail sales and industrial production growth, inflation, money supply, spot FX performance versus the dollar, policy rate, and ten year local government bond yield interest rates. The report is intended as a tool for both reference and idea generation. It’s clients’ first stop for basic background info on how a given economy is performing, and what issues are driving the narrative for that economy. The dashboard helps you get up to speed on and keep track of the basics for the most important economies around the world, informing starting points for further research and risk management. It’s published weekly every Wednesday at the Bespoke Institutional membership level.
You can access our Global Macro Dashboard by starting a 14-day free trial to Bespoke Institutional now!
Bespoke’s Morning Lineup – 12/4/19 – Attempting a Bounce
See what’s driving market performance around the world in today’s Morning Lineup. Bespoke’s Morning Lineup is the best way to start your trading day. Read it now by starting a two-week free trial to Bespoke Premium. CLICK HERE to learn more and start your free trial.

The Closer – Repo Represent, European Auto Sales, Mexican PMIs, Biotech Excess – 12/3/19
Log-in here if you’re a member with access to the Closer.
Looking for deeper insight on markets? In tonight’s Closer sent to Bespoke Institutional clients, we begin with a review of the current repo market environment. Given the light day for US data, we then take a look at European autos data. We finish with Mexico’s very negative PMI data and the surge that biotech has experienced recently.
See today’s post-market Closer and everything else Bespoke publishes by starting a 14-day free trial to Bespoke Institutional today!
Bespoke Market Calendar — December 2019
Please click the image below to view our December 2019 market calendar. This calendar includes the S&P 500’s average percentage change and average intraday chart pattern for each trading day during the upcoming month. It also includes market holidays and options expiration dates plus the dates of key economic indicator releases. Start a two-week free trial to one of Bespoke’s three research levels.

Chart of the Day – Streaks Without a 1% Intraday Range
Bespoke’s Morning Lineup – 12/3/19 – Turnaround (of a Turnaround) Tuesday
US equities are poised to open down over a half percent this morning, and equity index futures are at session lows thanks to fresh trade tape-bombs from the President. His comments, which suggested that he doesn’t think a trade deal is necessary before the election, quickly turned what was a positive picture for equity futures negative (see chart below).
There’s little in the way of economic data on the calendar today, so it looks like another day of China-trade related back and forth. Keep in mind too, that even after yesterday’s pullback, the S&P 500 is over 2.5% above its 50-day moving average and nearly 6% above its 200-day moving average. In other words, we have been overdue for a pause at the very least.
See what’s driving market performance around the world in today’s Morning Lineup. Bespoke’s Morning Lineup is the best way to start your trading day. Read it now by starting a two-week free trial to Bespoke Premium. CLICK HERE to learn more and start your free trial.

The Closer – No News Is Good News – 12/02/19
Log-in here if you’re a member with access to the Closer.
Looking for deeper insight on markets? In tonight’s Closer sent to Bespoke Institutional clients, given the impact trade headlines have had on the market in the past year, we begin with a look at how little tariffs have been mentioned in the news recently. We also show the rare simultaneous movements of stocks, rates, and the dollar. Next we make note of where global manufacturing activity stands and what it means for the economy and forward equity returns. We finish with a review of today’s construction spending data.
See today’s post-market Closer and everything else Bespoke publishes by starting a 14-day free trial to Bespoke Institutional today!
After Hours vs. Regular Trading Hours
The S&P 500 tracking ETF (SPY) is up roughly 25% year-to-date. But below we have broken out SPY’s 2019 move by after hours versus regular trading hours. The “after hours” strategy represents SPY’s move outside of regular trading hours — its change from the prior day’s close to the current day’s open. Given that most major events that impact the stock market occur outside of regular trading hours from 9:30 AM ET to 4 PM ET (like earnings reports, economic indicator releases, and anything that occurs in Asia or Europe before the US opens for trading), SPY nearly always opens at a different price that it closed at the prior trading day. When you see S&P 500 futures trading up significantly in pre-market trading, SPY’s opening price at 9:30 AM ET is going to be a lot higher than the price it closed at the prior day. When equity futures are down in pre-market trading ahead of the opening bell, it means SPY will open lower that day.
Conversely, the “regular trading hours” strategy represents SPY’s move from its opening price at 9:30 AM ET to its closing price at 4 PM ET. This strategy shows how well the stock market is performing on an intraday basis. When you combine the “after hours” move with the “regular trading hours” move, you get SPY’s full-day change from its prior close to that day’s close.
Below we show how well an investor would have done this year by just owning SPY after hours versus just owning SPY during regular trading hours. As shown, had you bought SPY at the close every day and sold it at the next day’s open, you would have a gain of 11.1%. On the other hand, if you did the opposite and bought at the open every day and sold at the close, you’d be up 12.3%.
Interestingly, the “regular trading hours” strategy started the year extremely strong, making up essentially all of the market’s gains over the first three months of the year. During that time period, the “after hours” strategy was essentially flat, which means SPY was opening flat and then seeing a lot of intraday buying.
During Q2 and Q3, there was a lot of back and forth with the “after hours” strategy. During periods when the trade war was really hot, we saw a lot of lower opens, but that stopped once the trade rhetoric cooled down. As shown, since the beginning of August, we’ve seen the “after hours” strategy go from up 0% YTD to up 11% YTD. Over the same time period, we’ve seen the “regular trading hours” strategy trade lower, although it’s up a little over the last two months. This has caused the two strategies to converge to near even on a year-to-date basis as we approach year-end.

if we run the strategy back to the start of 2018, the “after hours” strategy is still crushing the “regular trading hours” strategy. As shown below, had you bought at the close every trading day and sold at the next open, you’d be up 25.6% since the start of 2018. Had you instead just bought every open and sold at the close, you’d actually be down 7%. This means that more than 100% of the S&P’s gain over this time period has come outside of regular trading hours. Start a two-week free trial to Bespoke Institutional to access our research reports, interactive tools, and more.

Warren’s Loss is Health Care’s Win
From late summer through mid-November, betting markets (electionbettingodds.com) gave Senator Elizabeth Warren a considerable lead in the Democratic primary race. In fact, from late September through mid-October, betting markets gave her around a 50/50 shot at winning the primary. While there have been other spikes of interest in certain candidates like for Harris in July and Bloomberg more recently, no other candidate has been given the same type of high win probability at any point in the past several months. With that said, no other candidate has seen the type of fall from grace that Warren has either. As Warren’s policies and tactics like a wealth tax, attacks on billionaires, and health care reform have come under increased scrutiny, betting markets have retreated in their pricing in of a win for the senator. Warren’s probability to win the Democratic nomination is now down to just 16.5%. That is a 36.4 percentage point drop from the high. The only comparable decline is the 32.2 percentage point fall from the high for Senator Kamala Harris. This decline has led markets to give both Mayor Pete Buttigieg and former Vice President Biden higher chances of winning than Warren.

Taking a look at more primary data, this time from the Morning Consult’s weekly survey of Democratic Primary voters, Warren’s falling out of favor has been less dramatic but is in place nonetheless. After her favoritism among Democratic primary voters was on the rise consistently all year, it peaked out at 21% and has been rapidly declining over the past few weeks while Sanders and other candidates who have held a smaller share of votes, namely Buttigieg, have been on the rise.
Warren’s costly Medicare For All plan would essentially put private sector health insurers out of business. Her rise in the polls in 2019 did major damage to the insurers, and that held back the broad Health Care sector ETF (XLV) as well. That’s why Warren’s fall in the polls recently has gone hand-in-hand with a sharp rally for the Health Care sector, as shown in the second chart below. Start a two-week free trial to Bespoke Institutional to access our research reports, interactive tools, and more.
