
S&P 500 Energy Sector (XLE) Breaks Down
The S&P 500 Energy sector ETF (XLE) tried to break out of its downtrend in late 2019, but the bounce has been completely erased as of today with it plunging to new 52-week lows. Talk about an ugly chart. Start a two-week free trial to Bespoke Institutional to access our Bespoke Report, Chart Scanner, custom portfolios, and much more.

Remarkably, the Energy sector now has a weighting in the S&P 500 with a 3-handle – 3.97% to be exact. That’s less than 50 basis points larger than the Utilities sector, and less than 1.5 percentage points away from being the smallest sector in the entire index (which currently belongs to Materials at 2.52%).

Only twelve years ago, the Energy sector was less than 0.70 percentage points away from being the largest sector in the S&P 500. In mid-2008, the Energy sector’s weighting peaked at 15.96%, which was 67 basis points below Tech’s weighting of 16.63% at the time. Below is a long-term chart of the Energy sector’s weighting in the S&P 500 since 1990. The red line shows its average weighting of 9.03% over this time period. At current levels, Energy’s weighting is more than 50% below its historical average and easily at its lowest level of the last 30 years.

Below is a 10-year performance comparison of the S&P 500 Energy sector (XLE) versus the S&P 500 (SPY). As shown, XLE is now down 1.84% in price over the last ten years, while SPY is up 195.1%.

Below is a chart of XLE going back further to 1999 when the ETF began trading. From 1998 through mid-2008, the Energy sector was one of the best sectors to be in. It fell with everything else during the Financial Crisis and then managed to recover all of its losses and make new highs in 2014. It’s really only the last five years where the bottom has fallen out, especially relative to the rest of the stock market.

If we compare the price change of XLE to SPY since 1999, SPY has actually only recently overtaken the Energy sector in terms of performance. XLE is up 137% since the start of 1999 while SPY is up 169%. Just over five years ago, XLE was up more than 300% since 1999 versus SPY’s gain of 65%.

Chart of the Day: Monday 1%+ Gaps Lower
Bespoke’s Morning Lineup – 1/27/20 – A Case of the Mondays
See what’s driving market performance around the world in today’s Morning Lineup. Bespoke’s Morning Lineup is the best way to start your trading day. Read it now by starting a two-week free trial to Bespoke Premium. CLICK HERE to learn more and start your free trial.

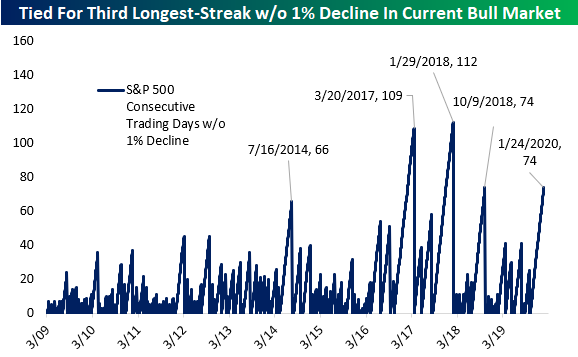
It’s going to be one of those days. US futures are down sharply this morning primarily on news of the spreading coronavirus and the Chinese government’s attempts to control it. S&P 500 futures are set to open down about 1.5% which would end the current streak of days without a 1% decline at 74.
Bespoke Brunch Reads: 1/26/20
Welcome to Bespoke Brunch Reads — a linkfest of the favorite things we read over the past week. The links are mostly market related, but there are some other interesting subjects covered as well. We hope you enjoy the food for thought as a supplement to the research we provide you during the week.
While you’re here, join Bespoke Premium for 3 months for just $95 with our 2020 Annual Outlook special offer.
Clearview
The Secretive Company That Might End Privacy as We Know It (DNYUZ)
An Australian technologist and app developer has launched a massive new surveillance tool designed to identify people in public places based on a complex algorithm. [Link]
Clearview AI Says Its Facial Recognition Software Identified A Terrorism Suspect. The Cops Say That’s Not True. by Ryan Mac, Caroline Haskins, and Logan McDonald (Buzzfeed News)
A controversial new company claims to have amassed a database of billions of photos which can be used to identify suspects using public sources. But the big claims – and the dystopian future they represent – are being called into question. [Link]
Metro Matters
Houston Is Now Less Affordable Than New York City by Peter Holley (Texas Monthly)
While land is cheap in Houston and wage levels are lower, reducing costs of living, the huge sprawl and lack of public transit actually makes it a relatively expensive city to live in. [Link]
NYC Moves to Ban Cashless Stores in Blow to Visa, Mastercard by Jennifer Surane (Bloomberg)
With some companies saying they will no longer accept cash at storefronts in New York City, the local government may enforce cash acceptance in order to protect access for customers that have a low income and lack access to electronic payments. [Link; soft paywall]
Eastern Europe
Belarus’ hi-tech export close to $15bn in 2019 (BelTA)
It’s unusual to think about Belarus when you mention high tech exports, but the tiny country is developing its focus on those types of goods and has made huge strides given their tiny size. [Link]
Health
98.6 Degrees Fahrenheit Isn’t the Average Anymore by Jo Craven McGinty (WSJ)
Changes in the human body over the last couple of centuries tied to more sedentary lifestyles have reduced the “normal” temperature of the human body. [Link; paywall]
Wuhan coronavirus may have been transmitted to people from snakes by Jessica Hamzelou (NewScientist)
The spreading coronavirus which started in Wuhan, China came from an animal, but the specific one in question may have been a snake. [Link]
Tired Nation: Americans Now Averaging Less Than 6 Hours Of Sleep Per Night by John Anderer (Study Finds)
While the amount of sleep every person needs varies, broad averages for the amount of sleep Americans get has made a new low. [Link]
Size Does Matter
Daily Fantasy Player Files Lawsuit Against MLB Over Astros Scandal by Darren Rovell (Action Network)
A New York daily fantasy player has named MLB as well as two teams in a cheating scandal that has rocked the league after unravelling this winter. [Link]
The IRS Decided to Get Tough Against Microsoft. Microsoft Got Tougher. by Paul Kiel (ProPublica)
An effort by the IRS to seal a massive tax dodge by Microsoft (via Puerto Rico) was stymied by a combination of administrative dancing, lawsuits, and Congressional lobbying that ultimately led to a change in the law in the software company’s favor. [Link]
Politics
The Black Swan Chart Of 2020 (Global Macro Monitor)
After a multi-decade high in voter turnout during 2018 midterm elections, voters are indicating rabid enthusiasm for the coming Presidential contest. That sort of turnout surge would create chaos for modelers and present a very different set of challenges for campaigns than low-turnout elections like 2016. [Link]
Unwired
Did someone put this Baltimore drug corner on Google Maps? by Dan Rodricks (Baltimore Sun)
An enterprising Google Maps user created a Google Maps listing for a drug corner in south Baltimore. This corner is known for its easy heroin availability. [Link]
Sonos Will Soon End Software Support for Its Older Speakers by Lauren Goode (Wired)
After 10+ years of use, the oldest generation of popular Sonos speakers are set to have their support cut off, in a move that may be poorly received by some of the company’s original customers. [Link]
Hyperbole
Guggenheim Says Central Bank-Driven ‘Ponzi Scheme’ Must Collapse by Ross Larsen, Sonali Basak, and Sridhar Natarajan (Bloomberg Quint)
The head of Guggenheim Investment Partners has decided to use some pretty ridiculous language to assess the current state of markets, but it speaks to still-restrained sentiment that people are regularly saying this sort of thing in public. [Link]
Read Bespoke’s most actionable market research by joining Bespoke Premium today! Get started here.
Have a great weekend!
The Bespoke Report — 1/24/20
The Closer: End of Week Charts — 1/24/20
Looking for deeper insight on global markets and economics? In tonight’s Closer sent to Bespoke clients, we recap weekly price action in major asset classes, update economic surprise index data for major economies, chart the weekly Commitment of Traders report from the CFTC, and provide our normal nightly update on ETF performance, volume and price movers, and the Bespoke Market Timing Model. We also take a look at the trend in various developed market FX markets.
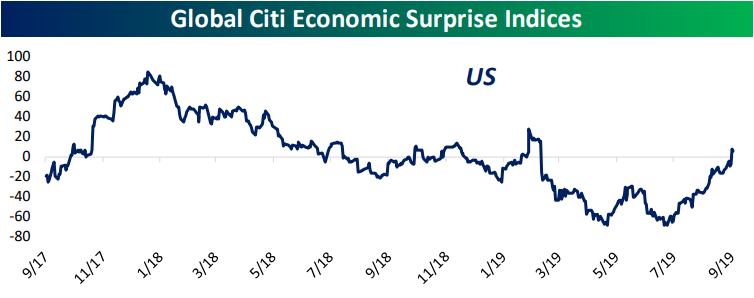
The Closer is one of our most popular reports, and you can sign up for a free trial below to see it!
See tonight’s Closer by starting a two-week free trial to Bespoke Institutional now!
Utilities Go Up, Up, and Away
News of the coronavirus spreading further in the last 24 hours has sent a risk-off attitude throughout markets. One result of these moves has been a more distinct breakout of treasury yields as the 20+ Year Treasury ETF (TLT) has broken out of the downtrend that it has been in since the summer. At its current levels today, it is now at its highest level since October.

TLT is not the only ETF to have benefitted from a more risk-averse sentiment. As of this writing, Utilities (XLU) is the only sector ETF looking to close higher today. XLU’s rally hasn’t just been confined to today either. With interest rates falling, Utilities (XLU) have gone on an absolute tear recently. Since eclipsing its prior high just below $65 a little over a week ago, XLU has rallied roughly 5%.

Given this massive rally, breadth has been extremely strong. Now at 70.5, the 10-day advance/decline line has become very stretched. In fact, it is very rare to see these levels in the Utilities sector’s 10-day A/D line as there has only been one other period since 1990 that it was higher (June 2017) when it reached 72.14. Start a two-week free trial to Bespoke Institutional to access our Morning Lineup and Closer which will also grant access to our Daily Sector Snapshot.

Clean Energy Outshining
Looking across the ETF space, there are only a handful with dividend yields above 10%. While most high yielding ETFs are income-focused funds there is currently one outlier: the VanEck Vectors Coal ETF (KOL). This ETF focuses on equities associated with coal mining, equipment, and transportation. As investors have favored more sustainable options over fossil fuels, the deterioration in KOL’s share price over the past couple of years has elevated the yield to more than 11.5%. In other words, that high yield has come at a cost.
KOL has already fallen over 8% in 2020 and that is in the context of a 21.25% decline in 2019 and more general weakness of the energy sector. While KOL has majorly lagged the S&P 500, its underperformance is even more dramatic when compared to clean-energy focused ETFs which have gained favor as ESG investing has stepped into the spotlight as we discussed in last week’s Bespoke Report. As shown below, the Solar ETF (TAN) was actually one of the top-performing of these in 2019, notching a 66% gain and now adding another 8.21% YTD. Likewise, the SPDR S&P Kensho Clean Power ETF (CNRG) and Invesco WilderHill Clean Energy ETF (PBW) also rose twice as much as the S&P 500 in 2019. Though CNRG’s year to date outperformance versus the S&P 500 is marginal, the general trend has remained in place so far.

KOL has not only been in a downtrend over the past year but over the past week it has broken down further. That comes after a gap down in late December which broke through support that had been in place since August. While KOL has legged lower, clean energy ETFs have gone parabolic.
Overall, the price changes of these ETFs and their underlying stocks helps to illustrate the general rotation out of fossil fuel focused stocks and into those that are more climate-conscious. Some of this recent strength for CNRG and PBW comes as a result of the strong performance of electric vehicle stocks like Tesla (TSLA) and Nio (NIO) which are some of the largest holdings. Similarly, TAN owes some of its gains in recent weeks to the strong performance of its top holdings. While not as large as TSLA’s 30% gain in 2020, TAN’s top holding of SolarEdge (SEDG) has experienced a similar rally to NIO of around 15% year to date. That is after it rose 167.8% in 2019. Start a two-week free trial to Bespoke Institutional to access our Bespoke Report, Chart Scanner, custom portfolios, and much more.

Bespoke’s Morning Lineup – 1/24/20 – Semis Continue to Rip
See what’s driving market performance around the world in today’s Morning Lineup. Bespoke’s Morning Lineup is the best way to start your trading day. Read it now by starting a two-week free trial to Bespoke Premium. CLICK HERE to learn more and start your free trial.
What a difference a few months makes. It was only six months ago that Intel (INTC) was starting to be considered an also-ran in the semiconductor space. After a number of management shakeups and production issues in its rollout of chips using 10nm technology, INTC was losing market share to AMD, and the stock languished. When the company reported earnings last July, its stock declined 1% in reaction to the report. While that wasn’t a sharp decline, it was the fifth time the stock had reacted negatively to earnings in the prior six quarters. Not only that, but the stock was also near 52-week lows when the Philadelphia Semiconductor Index was near 52-week highs. INTC used to be the leader in the semiconductor space, but last July it seemed to be looking more like Bethlehem Steel in the early 1990s than a leading company in the technology sector.
That report last July marked what was a low point for INTC on a relative basis, though. Ever since then the stock has been rolling, and even before last night’s earnings triple play the stock was already in the midst of a multi-year breakout that will likely look even more convincing after today. In pre-market trading, the stock has been losing some steam from its overnight highs, but it is still up over 5% after what was already a strong move heading into the report.

The Closer – Yellow Brick Road, Primary Placement, Leading Away – 1/23/20
Log-in here if you’re a member with access to the Closer.
Looking for deeper insight on markets? In tonight’s Closer sent to Bespoke Institutional clients, we begin with the implications of the uptick in Australian inflation expectations before turning to US politics. We show the current standings of the major Democratic candidates headed into the primaries. Next we recap the Conference Board’s Leading index and KC Fed manufacturing data. We finish with our weekly look at EIA data and an abridged version of our Fixed Income Weekly.
See today’s post-market Closer and everything else Bespoke publishes by starting a 14-day free trial to Bespoke Institutional today!