
Russell 1,000 Most Heavily Shorted Stocks
In Monday’s Closer, we detailed the short squeeze in Tesla (TSLA) that has been playing out. Back in May, when short interest as a percentage of float for TSLA topped out at 33.16%, it was the third most highly shorted stock in the Russell 1,000. Today, you will not find Tesla in the top 10, 20, or even 30 of the most heavily shorted Russell 1,000 stocks. In fact, after rallying well over 100% so far in 2020, it is the 37th most highly shorted stock with 17.55% of the float short. Of the most heavily shorted stocks, TSLA by far is the largest with a market cap of $127.32 bn.
The table below lists the 40 stocks in the Russell 1000 with the highest short interest as a percentage of float. Behind TSLA, the second-largest stock in terms of market cap of the stocks listed is Match Group (MTCH) which is less than a fifth the size of TSLA. Currently, MTCH is also the only stock in the Russell 1000 with more than half of its shares shorted (60.14%). That is after it was one of the top performers of the group last year, rising 95.79%. Some other big winners in 2019 which are now being bet against the most are Beyond Meat (BYND) that rose over 200% since its IPO, Carvana (CVNA) which rose 187%, Ubiquiti (UI) which rose over 93%, and Caesars Entertainment (CZR) which is also up over 100%. On the other hand, big losers like Range Resources (RRC), Antero Midstream (AM) and 2U (TWOU) continue to be bet against amidst major declines in the past year, and they have not found any respite so far in 2020.
In terms of performance for most heavily shorted stocks so far this year, of the stocks listed below, the average YTD change is a gain of 1.3%. However, if you take Tesla (TSLA) out fo the mix, the average performance shifts to a decline of 1.75% as 23 of the 40 stocks listed are down YTD. Start a two-week free trial to Bespoke Institutional to access our full library of reports and interactive tools.

Bespoke’s Morning Lineup – 2/5/20 – 2.0
See what’s driving market performance around the world in today’s Morning Lineup. Bespoke’s Morning Lineup is the best way to start your trading day. Read it now by starting a two-week free trial to Bespoke Premium. CLICK HERE to learn more and start your free trial.
Global equities are in rally mode again this morning on easing concerns over the impact of the coronavirus and news of possible treatments. One number we’ve been watching closely over the last couple of weeks is the mortality rate which continues to drop. Through the latest reported global statistics, the mortality rate has dropped down to 2.01% which is the lowest we have seen since statistics have been published.
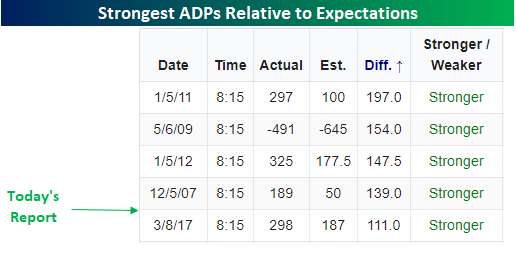
In economic news this morning, the ADP Private Payrolls report came in much higher than expected (291K vs. 157K). This was the strongest monthly print since May 2015 and the best report relative to expectations since the December 2011 report on 1/5/12 (325K vs 178K).

In economic news this morning, the ADP Private Payrolls report came in much higher than expected (291K vs. 157K). This was the strongest monthly print since May 2015 and the best report relative to expectations since the December 2011 report on 1/5/12 (325K vs 178K).
The Closer – Yield Bounce, Earnings Interest, Manufacturing Sales, States Lead – 2/4/20
Log-in here if you’re a member with access to the Closer.
Looking for deeper insight on markets? In tonight’s Closer sent to Bespoke Institutional clients, we take a look at the move higher in rates from a technical perspective as well as news out of Disney (DIS) and Facebook (FB). We then recap today’s durable goods data and Mexican remittance numbers. We finish tonight with a look at state-level leading indices.
See today’s post-market Closer and everything else Bespoke publishes by starting a 14-day free trial to Bespoke Institutional today!
Chart of the Day: Bubble Bubble On The Boil
JetBlue (JBLU) Fading Airline Blues
Earlier today, we updated our weekly Stock Scores with major US airliner JetBlue (JBLU) taking the number one spot. Our Stock Scores ranks every company in the S&P 1500 based on a fusion approach, combining proprietary ratings across fundamental, technical, and sentiment analysis. JBLU is one of the smaller US airlines with a total market cap of $5.2 bn compared to competitors like Delta (DAL), Southwest (LUV), United (UAL), and American Airlines (AAL), which all have market caps between $10 bn and $32.8 bn. While earnings for this industry have not necessarily been weak, those companies exposed to the ongoing Boeing 737 MAX saga have continued to report headwinds, and shutdowns on account of the coronavirus have added more uncertainty to the overall outlook of the industry. But for JBLU, the picture is a bit rosier. Unlike some of its larger competitors, JBLU does not fly the 737 MAX, and its flights to Asia are limited when compared to other airlines as it focuses on the domestic, Caribbean, and Latin American markets. This contributed to a solid quarter recently as the company exceeded EPS estimates and reported stronger than expected revenues which were up 3.2% YoY.
Headed into its most recent earnings report on January 23rd, JBLU reached the upper end of the past two year’s range as shown in the chart below. The 6.41% rally on earnings lifted the stock back above the $20 resistance level which it has since come back and successfully retested.

Meanwhile, the charts of other airline stocks are not looking as strong with many having broken down or sitting in short term downtrends. Members can view the charts of all of these airline stocks using this custom portfolio we created.
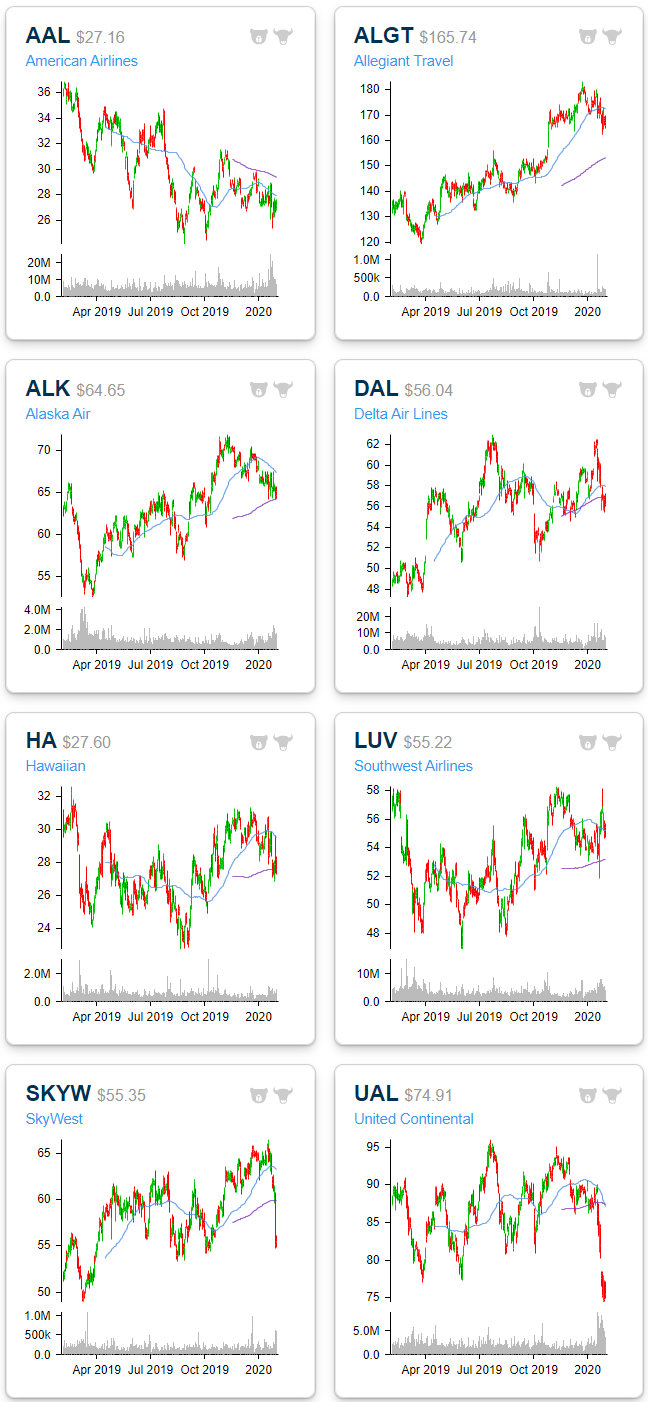
Again, JBLU’s breakout has been more of an exception rather than the rule for the industry. The chart below of the U.S. Global Jets ETF (JETS), which tracks the global airline industry including operators and manufacturers, shows exactly this. Like JBLU, in the first weeks of this year, the ETF had been testing the past year’s highs, but once coronavirus fears began to ramp up (namely as Delta, American Airlines, and United Airlines began to suspend service to China), JETS turned sharply lower and has fallen out of the past few months’ range.
After these declines, the average airline stock in the S&P 1500 now has the lowest P/E ratio of all GICS Level 3 Industries. Given this, JETS has one of the cheaper valuations of the ETF universe. The fund’s P/E ratio is now only 8.76 which is also especially cheap when compared to a 23.12 P/E for the broader Industrial Sector ETF (XLI). Overall, although the 737 MAX and more recent coronavirus headwinds have not gone away, the airline industry is now looking relatively cheap to the rest of the market and JBLU appears to be the best of breed of these stocks. Start a two-week free trial to Bespoke Institutional to access our Stock Scores, Custom Portfolios, and much more.

Bespoke’s Morning Lineup — Another Turnaround Tuesday — 2/4/20
See what’s driving market performance around the world in today’s Morning Lineup. Bespoke’s Morning Lineup is the best way to start your trading day. Read it now by starting a two-week free trial to Bespoke Premium. CLICK HERE to learn more and start your free trial.
The Closer – Tesla Soars, Google Flops, Construction, SLOOS – 2/3/20
Log-in here if you’re a member with access to the Closer.
Looking for deeper insight on markets? In tonight’s Closer sent to Bespoke Institutional clients, we begin with a dive into Tesla’s massive run-up over the past few weeks and where that leaves the company relative to other global auto manufacturers. Next, we review Alphabet’s (GOOGL) earnings before turning to today’s macroeconomic data including construction spending and the Federal Reserve’s first-quarter Senior Loan Officer Outlook Survey (SLOOS).
See today’s post-market Closer and everything else Bespoke publishes by starting a 14-day free trial to Bespoke Institutional today!
Bespoke’s Sector Snapshot — S&P 500 Sector Weightings
S&P 500 sector weightings are important to monitor. Over the years when weightings have gotten extremely lopsided for one or two sectors, it hasn’t ended well. Below is a table showing S&P 500 sector weightings from the mid-1990s through 2016. In the early 1990s before the Dot Com bubble, the US economy was much more evenly weighted between manufacturing sectors and service sectors. Sector weightings were bunched together between 6% and 14% across the board. In 1990, Tech was tied for the smallest sector of the market at 6.3%, while Industrials was the largest at 14.7%. The spread between the largest and smallest sectors back then was just over 8 percentage points.
The Dot Com bubble completely blew up the balanced economy, and looking back you can clearly see how lopsided things had become. Once the Tech bubble burst, it was the Financial sector that began its charge towards dominance. The Financial sector’s sole purpose is to service the economy, so in our view you never want to see the Financial sector make up the largest portion of the economy. That was the case from 2002 to 2007, though, and we all know how that ended.
Unfortunately we’ve begun to see sector weightings get extremely out of whack once again.
If you would like to see the most up-to-date numbers for S&P 500 sector weightings, simply start a two-week free trial to our Bespoke Premium or Bespoke Institutional services. Click back to this post to see the numbers once you’re signed up!
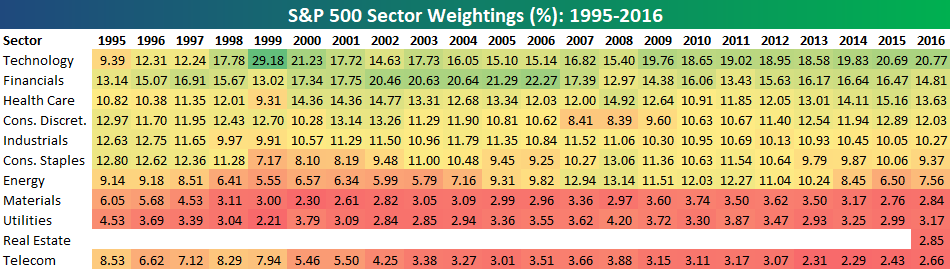
Chart of the Day: Earnings For Sale
Best and Worst Performing S&P 500 Stocks YTD
The average stock in the S&P 500 is currently down 0.65% year-to-date. There are 34 stocks in the index up 10%+ year-to-date, while there are 61 stocks that are down 10%+. As shown, L Brands (LB) ranks first at this point in 2020 with a year-to-date return of 26.2%. (Note that while Tesla (TSLA) is up 85% year-to-date and has a market cap that’s larger than 90% of the index, it’s not yet in the S&P 500.) Paycom (PAYC) and ServiceNow (NOW) rank 2nd and 3rd with gains of more than 20%, while Lennar (LEN) and TransDigm (TDG) round out the top five. Other notables on the list of this year’s biggest winners include Progressive (PGR), PulteGroup (PHM), salesforce.com (CRM), Albemarle (ALB), and Amazon.com (AMZN).

While there are three stocks up 20%+ YTD, there are four that are already down 20%+. TechnipFMC (FTI) is down the most at -21.85%, but Capri Holdings (CPRI) is not far behind at -21.32%. Diamondback Energy (FANG) and ViacomCBS (VIAC) are the other two stocks down 20%+. Other notables on the list of biggest losers so far in 2020 include DuPont (DD), Phillips 66 (PSX), Advance Auto Parts (AAP), Schlumberger (SLB), VF Corp (VFC), Dow (DOW), Kohl’s (KSS), Carnival Corp (CCL), and United Airlines (UAL).
