Richmond Fed’s Strong Finish to the Year
Whereas other regional Fed manufacturing readings like the Empire and Philly Fed were weaker than expected for December, today’s release from the Richmond Fed was a welcome surprise. Rather than the forecasted decline down to 11 from 15 in November, the headline number rose to a reading of 19. Although that is still off the record highs from earlier in the fall, the December print indicated that manufacturing activity in the region continued to grow at an accelerated and still historically strong rate.
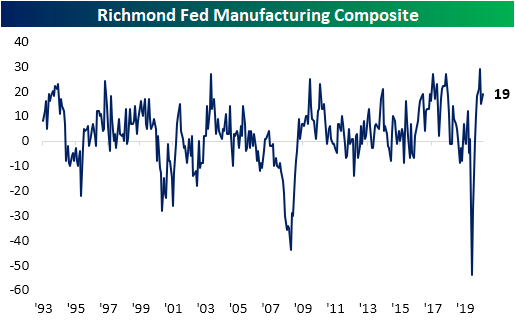
As shown in the table below, this month’s reading moved back into the top decile of all readings since 1993. As for the individual components, New Orders, Backlog of Orders, Vendor Lead Times, Number of Employees, Wages, and Average Workweek also all came in the top decile of historical readings. On the other hand, current condition indices covering expenditures, inventories, and Local Business Conditions remain much weaker relative to their historical range.
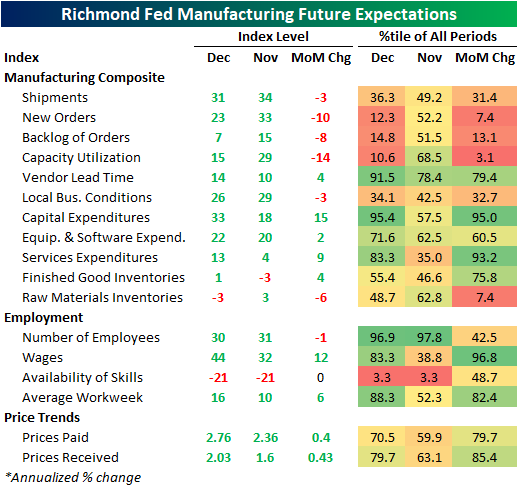
Breadth was broadly positive this month with only a small handful of indices falling month over month. Of those that fell, the most glaring decline was for Local Business Conditions. Its 17-point decline was the 8th largest on record. Granted, the index remained positive, but it was at a much slower pace than November. The indices for future expectations were generally weaker than November with a higher number of indices falling in December.
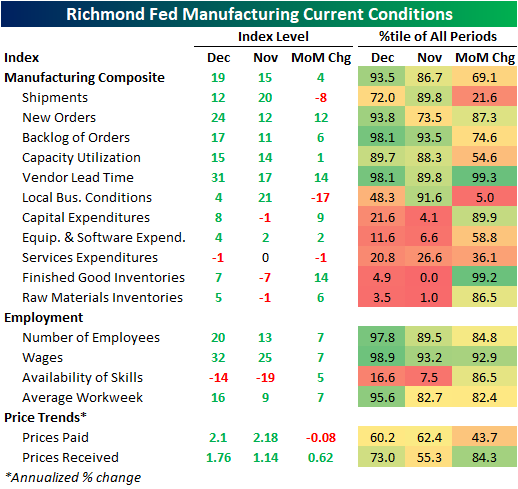
Demand has appeared to continue to recover with New Orders and Backlog of Orders both coming in at another strong expansionary reading in December. In fact, the Backlog of Orders index rose to the highest level since June 2018 which is also in the top 2% of all readings. Despite this, Shipments were lower falling 8 points to 12. That means shipments continued to rise in December but at a slower pace. Given the uptick in New Orders and Order Backlogs, that slowdown in Shipments could be more of a supply rather than a demand problem.
Some evidence of this is the index for Vendor Lead Times. Higher readings in this index indicate that suppliers are taking a longer time to get products to manufacturers. Vendor Lead Times are in the top 2% of all readings rising another 14 points to 31 in December. That 15-point increase was the largest since March when the index rose by 17 points. Before that, you would need to go all the way back to June of 1996—in the early days of the index when readings were all over the pace—to find another time that the index has risen by more in just one month.

The indices covering employment painted a positive picture for the region’s labor market with Number of Employees and Average Workweek both rising 7 points back up to their recent highs from a couple of months ago. While firms are taking on more people and lengthening the hours worked, they also report having trouble hiring the right people. The index for Availability of Skills remains around historically low levels even after rising 5 points in December. Given that tight labor market sign, the index for Wages also rose 7 points up to its highest level since May of last year. As with the indices for Number of Employees and Average Workweek, the increase this month in Wages leaves each of these indices in the upper percentiles of their historic ranges. Click here to view Bespoke’s premium membership options for our best research available.
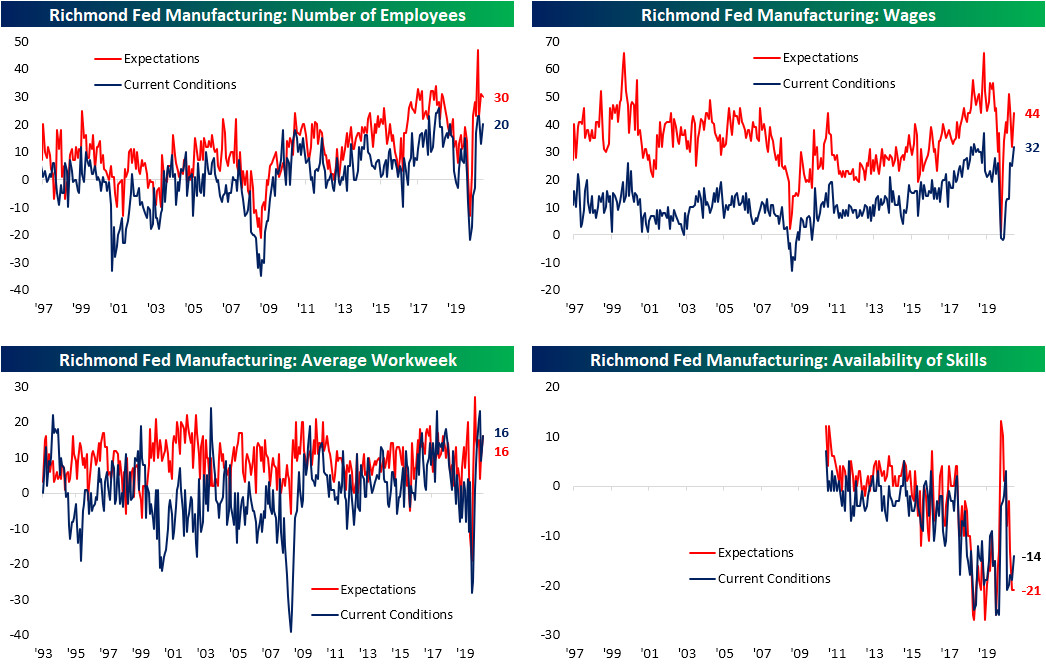
Chart of the Day – Closing in on a Record 200 Days
The rest of the year on Wall Street will be a time when many investors will be taking some time off, but when they return to work in the New Year, the S&P 500 will be closing out what has been a historic 200 trading days for the index. The current bull market hasn’t quite reached the 200-trading day point, but for most of its existence, it has ranked as one of the strongest at that point in its life. The first 190 trading days of this rally have been the strongest on record, just edging out the rallies coming off the March 2009 and August 1982 lows.
The chart below is from the Market Cycles section of our 2021 Annual Outlook. Among other topics in this section, we looked at prior bull markets that lasted 200 trading days or more and analyzed the S&P 500’s performance in the year that followed the first 200 trading days. The analysis found some interesting trends regarding overall performance and performance for individual periods. To see the entire analysis, sign up for our 2021 Outlook Special.


2021 Outlook – Bitcoin
Our 2021 Bespoke Report market outlook is the most important piece of research that Bespoke publishes each year. We’ve been publishing our annual outlook piece since the formation of Bespoke in 2007, and it gets better every year! In this year’s edition, we’ll be covering every important topic you can think of that will impact financial markets in 2021.
The 2021 Bespoke Report contains sections like Valuation, The Fed, Sector Technicals and Weightings, COVID, Dollar & Stocks, Yield Curve & Fed, Commodities, and more. We’ll also be publishing a list of our favorite stocks and asset classes for 2021 and beyond.
We’ll be releasing individual sections of the report to subscribers until the full publication is completed by year-end. Today we have published the “Bitcoin” section of the 2021 Bespoke Report, which looks at the cryptocurrency’s rally in 2020 and compares some of the similarities and key differences between now and then.
To view this section immediately and all other sections, become a member with our 2021 Annual Outlook Special!

Silver (SLV) Rallies And More of the Same From Gold (GLD)
Precious metals have been a top-performing asset in 2020 on a year to date basis, but over the past few months, silver (SLV) and gold (GLD) have together remained in a downtrend. More recently, though, the two have begun to diverge. While that downtrend is still in place for GLD (top chart), strong performance in recent days has resulted in SLV to break out of its own downtrend (second chart). Whereas the ETF sat below its 50-DMA about a week ago, in the five trading days through yesterday’s close, SLV rallied just over 10%. That leaves it extremely overbought at more than two standard deviations above its 50-day. GLD in the same span, on the other hand, has a much more modest 2.5%.

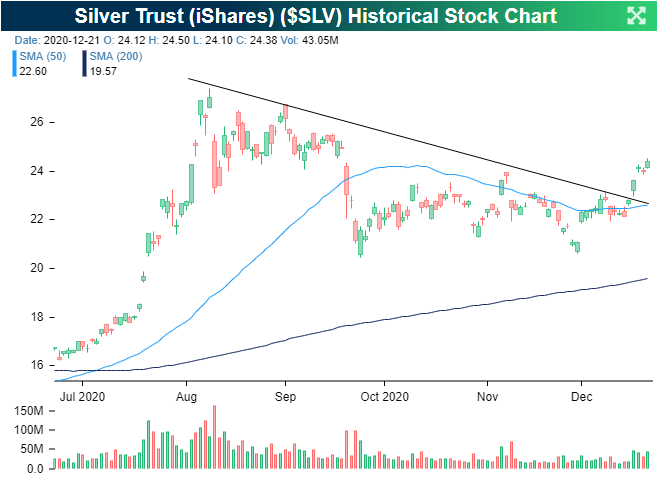
The breakout from its downtrend in silver has resulted in the ratio of the two to make a vertical move higher. As of yesterday’s close, the relative strength line of silver versus gold is back up to its highest levels since the first days of September.

For the silver ETF (SLV), rallies of 10% or more in the span of just 5 trading days have been fairly rare. Since it began trading back in 2006, there have only been 13 occurrences without another instance in the prior three months. As shown in the table below, the last time such a move took place was in March of this year. Prior to that, the last instance was way back in July of 2016.
Even though those big short term moves may seem like SLV has momentum at its side, performance following such moves has been fairly weak. As shown in the table below, at various periods over the following year, only six months out has averaged positive returns for SLV with that positive performance only occurring half the time. Of the other periods, SLV has averaged declines with positive returns less than half the time. Looking at these instances plotted on the chart of SLV, most of these moves within the past decade have come around the time of a short term peak. Before that, though, only the March 2008 occurrence saw this type of pattern as the other instances were typically followed by further moves higher.
With regards to silver’s yellow cousin, gold, performance after these same instances has been a bit stronger but generally remains weak over the following week, month, and three month periods. Six months to one year out have usually been stronger, though, averaging positive returns. Similar to SLV, the occurrences of the past decade have tended towards weakness while for those prior to that the opposite holds true. Click here to view Bespoke’s premium membership options for our best research available.


Bespoke’s Morning Lineup – 12/22/20 – Stimulus Passed & Encouraging COVID Trends
See what’s driving market performance around the world in today’s Morning Lineup. Bespoke’s Morning Lineup is the best way to start your trading day. Read it now by starting a two-week free trial to Bespoke Premium. CLICK HERE to learn more and start your free trial.
“I can calculate the motions of the heavenly bodies, but not the madness of people.” – Isaac Newton
Just in time for Christmas, the long tortuous process of a stimulus deal is finally behind us, but there is still a lot of data to contend with over the next two trading days. With the stimulus passed, there’s a likelihood that investors will look past any weakness as there’s help on the way, so that’s something to keep in mind as the data rolls out. In COVID news, as shown on page six of the Morning Lineup, the number of confirmed cases is showing some signs of a peak, and hospitalizations in Midwest states that were hit the earliest in this most recent wave, have shown signs of receding.
Be sure to check out today’s Morning Lineup for updates on the latest market news and events, a recap of Machine Tool Orders in Japan, an update on the latest national and international COVID trends, and much more.

When a stock gaps up 3% at the open, it doesn’t typically attract a lot of attention, but when that gap is coming from the largest publicly traded company in the United States, it’s worth highlighting. It has now been more than three months since shares of Apple (AAPL) traded at a new high, but it’s starting to get close. The stock is indicated to open at $132 this morning, which would put it less than 5% from a new high and at a level it has only closed above one other time in its history (9/1).

Chart of the Day: Banks Playing Catchup
The Bespoke Report 2021 — Sectors
Our 2021 Bespoke Report market outlook is the most important piece of research that Bespoke publishes each year. We’ve been publishing our annual outlook piece since the formation of Bespoke in 2007, and it gets better every year! In this year’s edition, we’ll be covering every important topic you can think of that will impact financial markets in 2021.
The 2021 Bespoke Report contains sections like Valuation, The Fed, Sector Technicals and Weightings, COVID, Dollar & Stocks, Yield Curve & Fed, Commodities, and more. We’ll also be publishing a list of our favorite stocks and asset classes for 2021 and beyond.
We’ll be releasing individual sections of the report to subscribers until the full publication is completed by year-end. Today we have published the “Sector Weightings and Technicals” section of the 2021 Bespoke Report, which looks at historical trends in weightings for S&P 500 sectors, long-term sector chart patterns, and 2020 correlations across sectors and asset classes.
To view this section immediately and all other sections, become a member with our 2021 Annual Outlook Special!
2021 Outlook – Commodities
Our 2021 Bespoke Report market outlook is the most important piece of research that Bespoke publishes each year. We’ve been publishing our annual outlook piece since the formation of Bespoke in 2007, and it gets better every year! In this year’s edition, we’ll be covering every important topic you can think of that will impact financial markets in 2021.
The 2021 Bespoke Report contains sections like Valuation, The Fed, Sector Technicals and Weightings, COVID, Dollar & Stocks, Yield Curve & Fed, Commodities, and more. We’ll also be publishing a list of our favorite stocks and asset classes for 2021 and beyond.
We’ll be releasing individual sections of the report to subscribers until the full publication is completed by year-end. Today we have published the “Commodities” section of the 2021 Bespoke Report, which discusses the performance of the broad commodities markets in 2021. We review the performance of specific commodities this year, as well as very long-term price trends and charts. We finish up with looks at the energy trade balance as well as the surging share of renewable energy production in the US.
To view this section immediately and all other sections, become a member with our 2021 Annual Outlook Special!
2021 Outlook – COVID
Our 2021 Bespoke Report market outlook is the most important piece of research that Bespoke publishes each year. We’ve been publishing our annual outlook piece since the formation of Bespoke in 2007, and it gets better every year! In this year’s edition, we’ll be covering every important topic you can think of that will impact financial markets in 2021.
The 2021 Bespoke Report contains sections like Valuation, The Fed, Sector Technicals and Weightings, Stock Market Sentiment, Dollar & Stocks, Yield Curve & Fed, Commodities, and more. We’ll also be publishing a list of our favorite stocks and asset classes for 2021 and beyond.
We’ll be releasing individual sections of the report to subscribers until the full publication is completed by year-end. Today we have published the “COVID” section of the 2021 Bespoke Report, which discusses the pandemic’s impact on 2020, the outlook for vaccines, current status of the disease in the US and around the world, and which changes wrought by COVID are likely to stick around longer than the virus.
To view this section immediately and all other sections, become a member with our 2021 Annual Outlook Special!
Bespoke’s Morning Lineup – 12/21/20 – Selling the News
See what’s driving market performance around the world in today’s Morning Lineup. Bespoke’s Morning Lineup is the best way to start your trading day. Read it now by starting a two-week free trial to Bespoke Premium. CLICK HERE to learn more and start your free trial.
“The path to innovation begins with curiosity” – Robert Iger, The Ride of a Lifetime
After opening right around the flat-line Sunday evening, futures plummetted overnight right in unison with the European open as fears over the spread of a ‘mutant’ more contagious strain of COVID in the UK have prompted travel restrictions into and out of the country. While the COVID news in the UK seems like a reasonable catalyst, we have a hard time squaring that with the fact that the UK news was out early Sunday and futures opened last night flat to slightly higher. A more likely explanation may be the fact that investors are taking profits into what will be an illiquid close to the year.
Be sure to check out today’s Morning Lineup for updates on the latest market news and events, a recap of the fiscal deal in Washington, an update on the latest national and international COVID trends, and much more.
The charts below show the S&P 500’s daily performance over the last six months and on an intraday basis for the last 15 trading days. After taking today’s declines into account, the S&P 500 will open the week for trading right about where it was ten days ago. Based on just the opening levels at least, today’s weakness will do little to break any significant support levels.
