Chart of the Day: Intraday Range Cools Off
Bespoke’s Morning Lineup – 2/10/22 – The CPI You’ve All Been Waiting For
See what’s driving market performance around the world in today’s Morning Lineup. Bespoke’s Morning Lineup is the best way to start your trading day. Read it now by starting a two-week trial to Bespoke Premium. CLICK HERE to learn more and start your trial.
“Things there are no solution to: Inflation, bureaucracy & dandruff.” – Malcolm Forbes
It’s finally here, the CPI report the world has been waiting for. Today’s CPI report for January is very likely one of the most-anticipated economic indicators of the year so far and leading up to it, futures were mixed with the Dow higher while the S&P 500 and Nasdaq marginally lower. That’s certainly a tentative tone given the strong earnings we have seen from the likes of Disney (DIS), Coca-Cola (KO), Uber (UBER), Mattel (MAT), and Twilio (TWLO), which are all up sharply in reaction to their reports. Treasury yields were likewise little changed heading into the report with the 2-year and 10-year maturities trading pretty much unchanged relative to yesterday’s close (1.34% and 1.93%, respectively).
CPI came in higher than forecasts with the headline reading surging 0.6% compared to forecasts for an increase of 0.4%. Core CPI also rose by the same amount versus forecasts for an increase of 0.5%. On a y/y basis, headline CPI was up 7.5% which was the highest reading since 1982. Core CPI was up 6.0% which was also stronger than expected and the highest since 1982. The initial market reaction has been – you guessed it – lower with equity futures selling off and treasury yields moving higher as the 10-year approaches 2.0% and the 2-year trades at 1.45%.
The other indicator released this morning was Jobless Claims which actually came in slightly lower than expected on an initial basis and slightly higher than expected on a continuing basis.
Read today’s Morning Lineup for a recap of all the major market news and events from around the world, including the latest US and international COVID trends.
Inflation has easily been the number one concern of investors for the last year now, but in looking at market performance on the day of prior reports since the start of 2021, you wouldn’t necessarily think the markets were preoccupied with inflation. Since the start of 2021, there has only been one CPI report that has come in weaker than expected (August report released on 9/14/21). Of the remaining 12 reports, eight have been higher than forecasts, and four have been right in line with estimates.
Given all those higher than expected reports, you would think that the average S&P 500 performance on CPI days since the start of 2021 would be negative and Treasury yields would move higher, but that hasn’t really been the case. As shown in the table below, the S&P 500’s average performance on the day of CPI reports since the start of 2021 has been a gain of 0.25% (median: -0.04%) with gains 61.5% of the time. Moves in the Treasury market have been even more counter-intuitive. On the 13 prior report days since the start of 2021, the yield on the 10-year US Treasury has dropped an average of nearly 2 basis points (median: -0.6 bps) with increases in yield less than a third of the time.

Start a two-week trial to Bespoke Premium to read today’s full Morning Lineup.
Chart of the Day: Bitcoin Breaks Its Downtrend
Bespoke’s Morning Lineup – 2/9/22 – A Half Correction
See what’s driving market performance around the world in today’s Morning Lineup. Bespoke’s Morning Lineup is the best way to start your trading day. Read it now by starting a two-week trial to Bespoke Premium. CLICK HERE to learn more and start your trial.
“A deception that elevates us is dearer than a host of low truths.” – Marina Tsvetaeva
Building upon yesterday’s momentum, US equity futures look to trade higher again this morning following strong sessions overnight in Asia and Europe. While there hasn’t been much in the way of a concrete catalyst, lower COVID case numbers and hospitalizations coupled with a trend of easing restrictions in the states that had some of the strictest mandates has investors optimistic that the long-delayed return to normal may be on the horizon. Today’s economic calendar is light, but there are still a ton of earnings to contend with, and we’re now just 24 hours from the biggest economic indicator of the week (and probably the month) with tomorrow’s CPI report for January.
Read today’s Morning Lineup for a recap of all the major market news and events from around the world, including the latest US and international COVID trends.
Yesterday’s rally and this morning’s strength in the futures markets have been welcomed by the bulls even if there wasn’t much in the way of a catalyst for the move. As markets look to stabilize after some recent volatility, below we provide a quick snapshot of where the major indices stand on a YTD basis and relative to their 50-day moving averages (DMA). The Nasdaq 100 (QQQ) has been the hardest hit YTD and heads into today’s trading session with a decline of nearly 10%. It is also the only major US index trading more than 5% below its 50-DMA. Along with the Russell 2000 (IWM), QQQ is the only other index ETF trading at ‘oversold’ levels (>1 standard deviation below its 50-DMA).
The technical definition of a market correction is a decline of 10% or more from a peak, and with the S&P 500 currently down just over 5% YTD, 2020 would currently qualify as a ‘half-correction’. SPY has barely moved out of oversold territory, but like the Nasdaq 100, it also remains below its 50-DMA. Finally, the Dow is often considered to be one of the least representative of the major indices, and it’s living up to that reputation this year. With a decline of just over 2% YTD, the Dow’s performance looks nothing like any of the other indices, and it’s the only one that is also anywhere close to trading above its 50-DMA. In fact, if current levels in the futures hold, it will be the only index ETF above its 50-DMA today.

Start a two-week trial to Bespoke Premium to read today’s full Morning Lineup.
Chart of the Day: Gold Consolidations
Sector Performance YTD: Energy Dominates
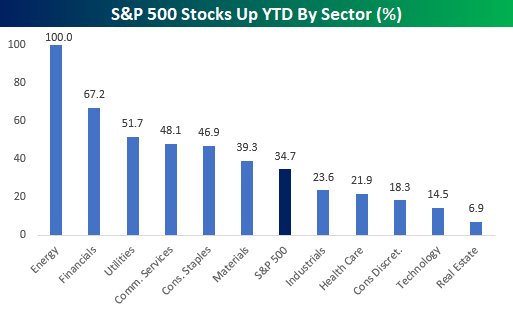
Earlier today in our Morning Lineup post, we highlighted the incredibly wide disparity between the performance of the S&P 500 Energy sector and the rest of the index. To further illustrate the divide, the charts below show the average YTD performance of S&P 500 stocks by sector as well as the percentage of stocks in each sector that are up YTD.
Starting with average performance, stocks in the Energy sector are up an average of 21.6% YTD which is more than 18 percentage points higher than the next closest sector (Financials). Energy is also one of just two sectors in the S&P 500 where the average YTD return of stocks in the sector is positive. For all the stocks in the S&P 500, the average YTD change is a decline of 4.1%, and in the Technology sector, its individual components are already down an average of just over 10% YTD!

With stocks in the Energy sector up an average of over 20% YTD, it shouldn’t come as too much of a surprise that every stock in the sector has posted YTD gains. After Energy, Financials and Utilities are the only two other sectors where more than half of the components are up YTD. For the S&P 500 as a whole, barely more than a third of stocks in the index are up YTD while less than 15% of Technology stocks and just 6.9% of stocks in the Real Estate sector (2 out of 29) are in the black. A number of strategists have said 2022 will be the year of the stockpicker, but so far this year, it’s been increasingly difficult for those stockpickers to find winners – especially outside of the Energy sector. See more in-depth market analysis from Bespoke by starting a two-week trial to Bespoke Premium today.
Bespoke’s Morning Lineup – 2/8/22 – New Highs in Yields
See what’s driving market performance around the world in today’s Morning Lineup. Bespoke’s Morning Lineup is the best way to start your trading day. Read it now by starting a two-week trial to Bespoke Premium. CLICK HERE to learn more and start your trial.
“We don’t have to be smarter than the rest. We have to be more disciplined than the rest.” – Warren Buffett
Futures are modestly higher for the S&P 500 and Dow this morning, but the Nasdaq is indicated to open lower in what’s looking like a mixed session for stocks. Futures started to lose some steam shortly after the European open as Treasury yields have been moving higher with the 10-year eclipsing 1.95% to its highest level since summer 2019.
The latest read on small business sentiment dropped to an 11-month low, but 61% of companies surveyed reported that they have raised prices, so inflation pressures remain firm. On a brighter note, WTI is trading back below $90 after hitting multi-year highs late last week.
Read today’s Morning Lineup for a recap of all the major market news and events from around the world, including the latest US and international COVID trends.
We’re barely a month into the new year, but 2022 is shaping up to be a year where it’s Energy and everyone else. Year to date, the sector is up over 25%, and besides Financials, which is up less than 3%, every other sector is staring at losses. The chart below shows the performance of the ProShares S&P 500 Ex Energy ETF (SPXE) compared to the performance of the S&P 500 Energy sector ETF over the last year. For much of the last twelve months, Energy has outperformed the S&P 500 Ex Energy, but as the calendar flipped to 2022, the divergence has widened out to extreme levels. Even as Energy has risen more than 25% this year, the rest of the S&P 500 is down close to 7% on a market-cap-weighted basis, and that has stretched the one year performance gap between the two ETFs over the last year to 50 percentage points (63.96% vs 13.95%).

Start a two-week trial to Bespoke Premium to read today’s full Morning Lineup.
Chart of the Day: Speculators Scatter
Gold “G-loiters”
Everyone knows that gold ‘glitters,’ but for the last year, it’s more like ‘gloiters’ as the commodity has been loitering around the $1,800 per ounce level. This morning, gold is trading modestly above $1,800, which is a level it has crossed above and below multiple times in the last 12 months. In fact, the average price of gold over the last 12 months has been $1,795 per ounce, so there hasn’t been a lot of movement.

Taking a longer-term look at gold shows some interesting trends. On a five year basis, the last 12 months of sideways trading looks like part of a consolidation phase for the commodity as it digests its big move higher from mid 2018 through early 2020 when prices surged from under $1,300 per ounce to more than $2,000.

While gold’s move over the last year looks like a consolidation of a strong rally on a five year chart, a ten year look at gold shows another trading range where prices today are right around the same level they were in 2012. As long as gold can hang around in the $1,700 to $1,800 range, the longer-term technical picture looks positive.

Just as the last year’s sideways pattern for gold looks like a consolidation of a strong rally on the five year chart, the sideways pattern of the last ten years looks like a very long-term consolidation following the rally in the early 2000s where prices rose more than six-fold from under $300 per ounce in early 2002 to nearly $1,900 in August 2011.
With a one-year trading range of less than 15%, gold is trading in its narrowest one-year range since July 2018, and before that, 2005. Eventually this range is going to break, and based on prior experience, once the range breaks, it usually expands pretty rapidly, so one direction or another, gold looks poised for a significant move going forward. See more in-depth market analysis from Bespoke by starting a two-week trial to Bespoke Premium today.

Bespoke’s Morning Lineup – 2/7/22 – Picking Up Steam
See what’s driving market performance around the world in today’s Morning Lineup. Bespoke’s Morning Lineup is the best way to start your trading day. Read it now by starting a two-week trial to Bespoke Premium. CLICK HERE to learn more and start your trial.
“I have never in my life envied a human being who led an easy life. I have envied a great many people who led difficult lives and led them well.” – Theodore Roosevelt
After a lower start overnight, futures have slowly picked up steam this morning and are now in modestly positive territory across the board with the Nasdaq leading the way higher. Overnight, economic data in Asia was on the weak side with China’s Services PMI missing expectations while Japan’s index of Leading Indicators decelerated relative to December.
Here in the US today, the only economic report on the calendar is Consumer Credit at 3 PM Eastern. On the earnings front, key reports after the close today include Amgen (AMGN), Tenet Healthcare (THC), and Simon Properties (SPG).
Read today’s Morning Lineup for a recap of all the major market news and events from around the world, including the latest US and international COVID trends.
If you talk to just about any investor lately, they’ll tell you that it has been a difficult year in the market. Putting the recent moves into perspective, it could have been a lot worse. Friday’s close marked 23 trading days since the S&P 500’s last closing record high, and during that span, the S&P 500 is down 6.2%. When comparing the last 23 trading days to other 23 trading day periods since 2000, there have been plenty of periods where the market saw much larger declines. Prior to the current period, the last time the S&P 500 declined 6% over a 23 trading day period was in late September 2020, but six months before that we saw what was the largest decline in a 23 trading day period since the Great Depression when the S&P 500 lost more than a third of its value from its peak on 2/19/20 to its low on 3/23/20.

Start a two-week trial to Bespoke Premium to read today’s full Morning Lineup.