Global Equities Reaching New 52-Week Lows
Being the last Wednesday of the month, today we published our most recent update of our Global Macro Dashboard which provides overviews of 22 major global economies. In the matrix below, we show the performance of ETFs that track the stock markets of these same countries.
Globally, stocks have gotten crushed in the past year with an average decline of 30% from 52-week highs; we would also note that developed markets have faired slightly worse than emerging markets. In fact, in the past few days, nearly every one of these countries has made a new 52-week low. There are a couple of holdouts though: Brazil (EWZ) and India (INDA). Compared to the S&P 500 low on June 16th (which was the 52-week low prior to this week and the level the index is currently hovering near) INDA and EWZ are again the only two countries with a solid gain by any stretch. As for one other distinguishing characteristic, these two countries are the only ones to not be in or be in the process of entering—as is the case with Mexico (EWW)—oversold territory.

While everything is well below current 52-week highs, there are only four country ETFs that are also above pre-COVID highs (the 52-week high as of the S&P 500 high on 2/19/20). India (INDA) is, of course, the most elevated above those levels at 13.5% followed by the US. Taiwan (EWT) and Canada (EWC) are within more tangible reach of pre-COVID highs given their recent breach of spring support has been far more material than SPY. Click here to learn more about Bespoke’s premium stock market research service.
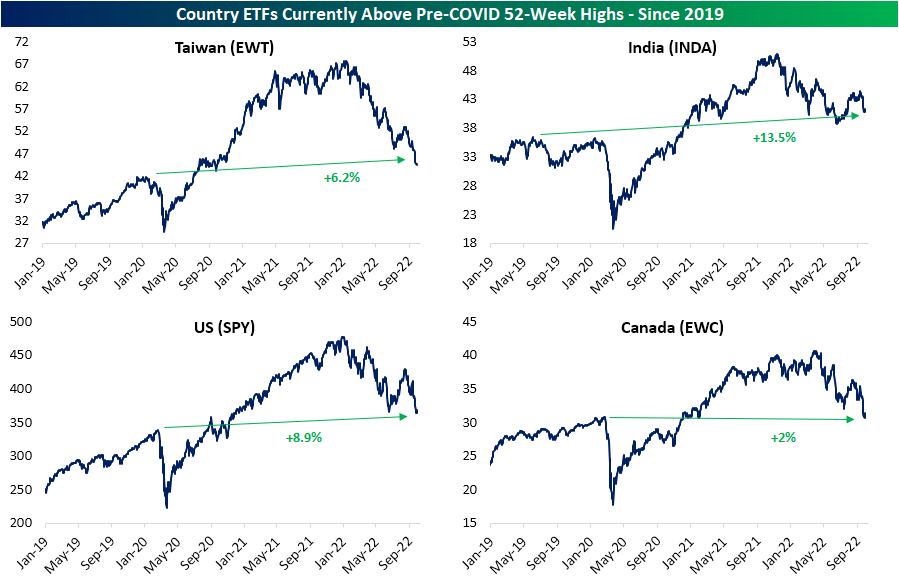
Chart of the Day – Seasonality: The Heart of the Year
Bespoke’s Morning Lineup – 9/28/22 – Britain Blinks
See what’s driving market performance around the world in today’s Morning Lineup. Bespoke’s Morning Lineup is the best way to start your trading day. Read it now by starting a two-week trial to Bespoke Premium. CLICK HERE to learn more and start your trial.
“History, Stephen said, is a nightmare from which I am trying to awake.” – James Joyce

Below is a snippet of content from today’s Morning Lineup for Bespoke Premium members. Start a two-week trial to Bespoke Premium now to access the full report.
Equity futures have been whipping around all over the place this morning. After some relatively steep declines overnight, this morning’s announcement from the Bank of England to buy long-dated government securities has put some temporary support in the market causing interest rates to pull back from their overnight highs and equity futures to rally. How long this reprieve lasts remains to be seen, but market participants will take any break they can get these days. On one positive note, we would note that from a historical perspective at least, over the last ten years, the upcoming three-month period for equities has been better than any rolling three-month period of the year.

Buying equities during the throes of a bear market can be a humbling experience, and never has that been more true than in 2022. The chart below shows the percentage of time that the S&P 500 tracking ETF (SPY) has traded higher on the day versus the period day’s close in each year of its existence. Since its inception in 1993, there have only been seven prior years where SPY traded higher on the day less than half of the time, but this year’s current pace of 43.8% is easily the lowest reading since SPY’s inception. The forces of gravity on stock prices haven’t been this strong or consistent in at least 30 years.

Our Morning Lineup keeps readers on top of earnings data, economic news, global headlines, and market internals. We’re biased (of course!), but we think it’s the best and most helpful pre-market report in existence!
Start a two-week trial to Bespoke Premium to read today’s full Morning Lineup.
Bear Market Breadth
As we highlighted in yesterday’s Chart of the Day as well as in our Sector Snapshot, the S&P 500’s 10-day advance decline (AD) line reached a record low at yesterday’s close. The 10-day AD line essentially measures the percentage of stocks in the S&P that have risen or fallen on a daily basis over a 10-day span. While the broad index saw its 10-day hit a record low, it was not alone. Real Estate (which admittedly has a smaller history of data only going back the past six years) and Technology also saw record low readings while a number of other sectors came close to records as well. As shown below, Materials had the fourth lowest reading, Energy and Industrials had the third lowest, and Health Care had the runner up lowest reading on record. For most sectors, these are readings that are well over 3 standard deviations below the norm since our data begins in 1990.
Additionally, the weak readings are somewhat unusual when compared to other bear markets. As shown, historically the 10-day AD lines of defensive sectors (Consumer Staples, Health Care, Real Estate, and Utilities) as well as Energy have averaged positive readings during bear markets. That is far from the case at the present moment with the strongest reading coming from Consumer Staples, however, even that reading is over 2 standard deviations lower than normal and ranked as the 121st worst reading of all trading days since at least 1990.

Pivoting over to a longer run look at breadth, the cumulative AD line has been confirming the moves in price with the line plummeting down towards the spring lows. That comes after the AD line went on a much stronger run than price during the late spring/summer rally.

Once again comparing the breadth line to past bear markets, below we show the path of the cumulative AD line over the course of each bear market since 1990. At the moment, the current bear is the third longest in terms of time, but the cumulative AD line is not quite at as low of a level as other bear markets. For example, the 2020 bear market as well as the 2007 to 2008 bear markets saw much lower readings and consistent moves lower than has been observed this year. At the highs this summer, the line even managed to move into positive territory. Click here to learn more about Bespoke’s premium stock market research service.

Bespoke Investment Group, LLC believes all information contained in this report to be accurate, but we do not guarantee its accuracy. None of the information in this report or any opinions expressed constitutes a solicitation of the purchase or sale of any securities or commodities. This is not personalized advice. Investors should do their own research and/or work with an investment professional when making portfolio decisions. As always, past performance of any investment is not a guarantee of future results. Bespoke representatives or clients may have positions in securities discussed or mentioned in its published content.
Stocks and Sectors with the Biggest Declines
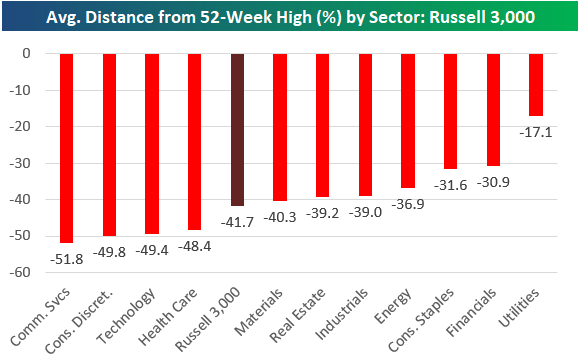
The average stock in the Russell 3,000 was down 41.7% from its 52-week high as of the close yesterday. That means the average stock would need to rally 71.5% from here to get back to its high. It’s much worse in some sectors, though. As shown below, four sectors have average prices roughly 50% below their 52-week highs. Communication Services is at -51.8%, Consumer Discretionary is at -49.8%, Tech is at -49.4%, and Health Care is at -48.4%. Even Energy stocks are 36.9% below their 52-week highs. Click here to learn more about Bespoke’s premium stock market research service.
Below is a look at the stocks that have seen the biggest drops in market cap since the end of 2021. Across the entire Russell 3,000, we’ve seen more than $13 trillion in market cap erased, and there have been five individual stocks that have seen their market caps fall by more than $500 billion — Microsoft (MSFT), Alphabet (GOOGL), Meta (META), Amazon (AMZN), and Apple (AAPL). There have been 18 stocks that have seen market cap fall by more than $100 billion, including names like Tesla (TSLA), JP Morgan (JPM), Home Depot (HD), Nike (NKE), Intel (INTC), and Cisco (CSCO). Five of the names on this list are down 60% from 52-week highs: META, NVDA, NFLX, ADBE, and PYPL. This is just true carnage in equities unlike anything we’ve seen since the Financial Crisis or the Dot Com bust.

If you want to see even more pain, below is a list of Russell 3,000 stocks with market caps still above $2 billion that are down more than 75% from their 52-week highs. These stocks collectively add up to just $300 billion in market cap at this point, and their market caps are down about $680 billion since the end of 2021.
Carvana (CVNA) and Peloton (PTON) are the only members of the “down 90%+” club, while stocks like Affirm (AFRM), Wayfair (W), RingCentral (RNG), Unity Software (U), Roku (ROKU), and Teladoc (TDOC) are down more than 80%. The list below is basically a “who’s who” of widely-traded growth stocks that saw huge gains post-COVID only to give it all back over the last year.

Chart of the Day: No Love For the Stock Market From Consumers
One Way Bonds
As noted in our Morning Lineup today, 2022 has been the year with no safety in US Treasuries. The declines this year have been painful and persistent. With the BofA 10+ Year US Treasury Index already down 7% this month, September will be the eighth month this year that long-term US Treasuries have had a negative total return, and there are still three months left in this miserable year! Even if they don’t have another down month this year, 2022 will be tied (with several other years) for the largest number of down months in a calendar year going all the way back to at least 1978.

On a rolling 12-month basis, the current backdrop is even more extreme. September will be the ninth month in the last twelve that long-term Treasuries were down, and that’s tied with October 1994 and August 2013 for the most in a twelve-month window. Furthermore, if either of the next two months are down, the rolling twelve-month total will move up to a record of ten. Click here to learn more about Bespoke’s premium stock market research service.

Bespoke’s Morning Lineup – 9/27/22 – No Safety In Treasuries
See what’s driving market performance around the world in today’s Morning Lineup. Bespoke’s Morning Lineup is the best way to start your trading day. Read it now by starting a two-week trial to Bespoke Premium. CLICK HERE to learn more and start your trial.
“Treasury securities are considered a safe and secure investment” – treasurydirect.gov
Below is a snippet of content from today’s Morning Lineup for Bespoke Premium members. Start a two-week trial to Bespoke Premium now to access the full report.
Futures are attempting to rebound this morning after yet another decline in the equity market yesterday. It’s a busy day for economic data as Durable Goods Orders were just released and came in roughly in line with expectations, but there are still several more indicators on the calendar with FHFA House Prices and Case Shiller at 9 AM Eastern and then Consumer Confidence, Richmond Fed, and New Home Sales all at 10 AM.
Treasuries took another pasting yesterday as yields once again surged to new multi-decade highs. Every day there’s another way to show the carnage, so here’s the one for today. The iShares Long Term Treasury ETF (TLT) fell nearly 2% yesterday taking its YTD decline to more than 30%. 30%. In Treasuries! Weren’t they supposed to be safe and boring? For most of our entire investment careers, when markets hit turmoil, market commentary would include something along the lines of “investors rotated into the safety and security of Treasuries. Even Treasurydirect.com, which is run by the Treasury Department says as much on its website.

2022’s word of the year could very well be turmoil, yet US Treasuries are having a down year for the ages. Even on a y/y basis, since its inception in 2003, TLT’s performance over the last 12 months has been the worst on record. It’s even down more than the Nasdaq!

The weakness in Treasuries is not to say that the performance of US equities has been positive this year. With the exception of the Dow ETF (DIA), every other ETF that tracks a major US index is down more than 20%, and every single one of them closed yesterday at ‘extreme’ oversold levels (more than two standard deviations below 50-DMA).

Our Morning Lineup keeps readers on top of earnings data, economic news, global headlines, and market internals. We’re biased (of course!), but we think it’s the best and most helpful pre-market report in existence!
Start a two-week trial to Bespoke Premium to read today’s full Morning Lineup.
Chart of the Day – 10-Day Advance/Decline Drops to Record Low
Bespoke’s Morning Lineup – 9/26/22 – Still Falling
See what’s driving market performance around the world in today’s Morning Lineup. Bespoke’s Morning Lineup is the best way to start your trading day. Read it now by starting a two-week trial to Bespoke Premium. CLICK HERE to learn more and start your trial.
“But I do think that we’re going to do all that we can at the Federal Reserve to avoid deep, deep pain. And I think there are some scenarios where that’s likely to happen.” – Raphael Bostic
Below is a snippet of content from today’s Morning Lineup for Bespoke Premium members. Start a two-week trial to Bespoke Premium now to access the full report.
You know it’s bad out there when a Fed official ‘thinks’ that the Fed will do all it can do to avoid ‘deep, deep pain’. Early on in the tightening cycle, Fed Chair Powell said that the Fed’s path to higher rates could result in a ‘softish landing’ for the economy. A few weeks later, he noted that the policy could be accompanied by ‘some pain’. Last week, the Fed chair told reporters that no one knows if this process will result in a recession. Over the weekend, it wasn’t the Fed chair speaking, but Atlanta Fed President Raphael Bostic had the comments above in an interview on ‘Face the Nation’. In the span of five months, Fed officials have gone from describing the impact of tighter policy on the US economy as a softish landing to short of ‘deep, deep pain’.
If there’s anything positive to say this morning, at least September has only a week left. Heading into the last trading week of the month, the S&P 500 has already shed 6.6% which ranks as one of the worst MTD performances heading into the last week of the month in the post-WWII period. The table below lists each year where the S&P 500 was down over 5% on the month heading into the last week of September along with how the index performed in the final week of the month.
In the 12 prior months where the S&P 500 was down over 5%, the final week of the month experienced a median decline of 0.44% with positive returns just 42% of the time. That’s hardly anything to get excited about, but it is also not much worse than the average performance for the final week of the month in all years since WWII (-0.34%). One thing you can probably count on is volatility. To close out the month. In 7 of the 11 prior years show, the S&P 500 was up or down at least 1% in the final week of the month. The most extreme downside move was 2.2% in 2002 while the most positive upside move was 7.8% in 2001.

Our Morning Lineup keeps readers on top of earnings data, economic news, global headlines, and market internals. We’re biased (of course!), but we think it’s the best and most helpful pre-market report in existence!
Start a two-week trial to Bespoke Premium to read today’s full Morning Lineup.