Bespoke Brunch Reads – 5/14/23
Welcome to Bespoke Brunch Reads — a linkfest of the favorite things we read over the past week. The links are mostly market related, but there are some other interesting subjects covered as well. We hope you enjoy the food for thought as a supplement to the research we provide you during the week.
While you’re here, join Bespoke Premium with a 30-day trial!
Retail
Tipping at Self-Checkout Has Customers Crying ‘Emotional Blackmail’ (WSJ)
Since when did paying for a cup of coffee warrant a 20% tip? Consumers are being inundated with gratuity requests, so their employers don’t have to pay them as much. [link]
Wendy’s, Google Train Next-Generation Order Taker: an AI Chatbot (WSJ)
The next time you go to the drive-through to order French Fries it may be a bot that takes your order. This is one way to solve the labor shortage. Will we have to tip the bots too? [link]
Investing
Robinhood to Launch 24-Hour Trading on Weekdays in Stocks and ETFs (WSJ)
Just what we need more to time to trade illiquid markets. Robinhood announced last week that it will offer “round-the-clock trading between 8 p.m. ET Sunday and 8 p.m. ET Friday in 43 securities, including some popular stocks such as Amazon.com, Apple and Tesla.” [link]
Investment App Commonwealth Hits Big With Mage’s Kentucky Derby Win (Front Office Sports)
Shareholders of Commonwealth made a $170,000 investment in Kentucky Derby winner Mage. That stake is now worth over $5 million, a 30x return for shareholders. [link]
EVs
The Executive Who Keeps Tesla Rolling Isn’t Elon Musk (WSJ)
A profile of Tesla’s CFO, Zach Kirkhorn, who many have credited with shoring up the company’s financial strength. Unlike Musk, who has over 100 million Twitter followers, Kirkhorn has 63. “He doesn’t take the limelight from Elon”. Many analysts who cover the stock have never even had a one-on-one conversation with him. [link]
Lithium is becoming more crucial in a warming world, but Maine’s huge deposits may never be mined because of environmental concerns. (Boston Globe)
Lithium deposits near Newry, Maine may be the largest in the country which would provide a strong boost to the state’s economy, but environmental regulations have prevented any development of the deposits. Too bad. Guess it’s back to burning coal and gasoline. [link]
End of a love affair: AM radio is being removed from many cars (Washington Post)
Due to interference from electric batteries, many EVs are being made without AM radios. But now where will we go for our political talk radio? [link]
Science and Nature
The Untold Story of the Boldest Supply-Chain Hack Ever (Wired)
The backstory behind the 2020 SolarWinds hack, which is considered the boldest supply chain hack ever. [link]
Before Smartphones and the National Weather Service, There Was Grandma’s Knee (New York Times)
Borrowing from ‘old school’ methods, researchers have developed a new weather forecasting model that mimics the flexibility of animal joints and the movement of clouds, potentially improving prediction accuracy. [link]
Hammerhead sharks are first fish found to ‘hold their breath’ (Nature)
It’s not just people that hold their breath underwater. This article on hammerhead sharks describes why as well as other traits of the unique shark. [link]
Sports
NFL schedule 2023 winners, losers: Jordan Love takes center stage; Colts shut out of prime time (The Athletic)
Only the NFL can manage to drum up so much excitement for the release of the next season’s schedule. Teams with the easiest expected schedules include the Dallas Cowboys and Los Angeles Chargers, while the Philadelphia Eagles and New Orleans Saints appear to have the toughest road to the playoffs. [link]
Economy
How soon and at what height will China’s economy peak? (economist)
Estimates vary, but at some point between 2025 and 2040, the Chinese economy is expected to peak and an aging population and rising levels of debt pose long-term challenges to country. [link]
Moving Out of a Flood Zone? That May Be Risky! (NY Fed)
Just because you move out of a ‘flood zone’ doesn’t necessarily mean your house won’t flood. This article discusses the potential risks of relocating out of flood-prone areas and explores potential policy solutions to help homeowners make informed decisions about relocation and mitigate the risks of flooding. [link]
The Monetary-Fiscal Policy Mix and Central Bank Strategy (St. Louis Fed)
Hawkish Federal Reserve member James Bullard describes why the Fed needs to counter easy fiscal policy, and that while continued disinflation is likely, it is not guaranteed. [link]
Mother’s Day
How Mother’s Day became its founder’s worst nightmare (National Geographic)
Ever wonder about the history behind Mother’s Day and how it ultimately became commercialized? [link]
Read Bespoke’s most actionable market research by joining Bespoke Premium today! Get started here.
Have a great weekend!
The Bespoke Report – 5/12/23 – Not Feeling It
This week’s Bespoke Report newsletter is now available for members. (Log in here if you’re already a subscriber.)
Legally speaking, 18 is the age when you are considered an ‘adult’ in the United States. That’s when you are old enough as an American to serve your country, vote, and be tried as an adult for any crimes you may commit. Eighteen may be the age when you are given extra responsibilities, but it doesn’t make you feel like an adult. You won’t be able to legally buy a beer for another three years, and in most states, you can’t even buy a pack of cigarettes without a fake ID. Most 18-year-old Americans still have several years left of school, and they can legally stay on their parent’s health insurance for another eight years. In other words, being 18 makes you an adult in name only.
From a technical perspective, we’re still in a bear market, but like an 18-year-old kid, it doesn’t necessarily feel that way. In fact, there isn’t much ‘feeling’ on the part of bulls or bears these days. As discussed in this week’s report, with seven months having passed since the October low, it doesn’t feel like a bear market, but with the S&P 500 up less than 20% from those lows, it hardly has the feeling of a bull market either. The S&P 500 is essentially right around the same levels it was at 12 months ago, nine months ago, six months ago, or three months ago!
Continue reading this week’s Bespoke Report newsletter by starting a one-month trial, or click the image below to view our membership options page.


Bespoke’s Morning Lineup – 5/12/23 – So Good, It’s Bad
See what’s driving market performance around the world in today’s Morning Lineup. Bespoke’s Morning Lineup is the best way to start your trading day. Read it now by starting a two-week trial to Bespoke Premium. CLICK HERE to learn more and start your trial.
“It’s tough to make predictions, especially about the future.” – Yogi Berra

Below is a snippet of content from today’s Morning Lineup for Bespoke Premium members. Start a two-week trial to Bespoke Premium now to access the full report.
What you think of the stock market these days will depend a lot on which index you’re looking at. While futures are up across the board today, the Dow has been down every day this week and eight of the last nine trading days. The Nasdaq, on the other hand, has been up in four of the last five trading days and is near its highs of the year. There’s little in the way of news driving the positive tone this morning, although the delay of the meeting between political leaders in DC over the debt ceiling until next week has been taken as a positive sign that the two sides are making progress. Along with the positive tone in futures, treasury yields are higher, but the two-year yield is still only at 3.92%. Crude oil prices are up modestly, and Energy Secretary Granholm has reportedly said that purchases for the SPR could resume in June.
On the economic calendar this morning, Import and Export prices will be released at 8:30 while Michigan Sentiment will be the least report of the week at 10 AM.
The performance disparity between major US equity indices has been well documented, but over the last several days, the gap has widened even more. Through yesterday’s close, the S&P 500 was up 7.6% on the year while the Dow was up only 0.5%. At 7.1%, the performance gap between the two indices on a YTD basis through 5/11 has never been wider, and the only time in the post-WWII period that it ever even exceeded five percentage points was in 1985 and 2020.
Given the differences in the way each index is constructed (market cap weighting of 500 stocks for the S&P 500 compared to a price-weighted index of 30 stocks for the Dow), performance disparities this large may not be too surprising, but since 1945, the correlation of daily returns for the two indices has been +0.95 meaning they’re almost perfectly correlated.
At the other end of the spectrum, there have been more years (seven) where the Dow outperformed the S&P 500 by over five percentage points YTD through this point in the year, but the most extreme was in 1999 when at this point in the year, the S&P 500 was up 10.3% while the Dow was already up over 20%! Comparisons between now and the late 1990s/early 2000s have been common, but in the case of performance disparities, the two periods couldn’t have been further apart.

Start a two-week trial to Bespoke Premium to read today’s full Morning Lineup.
Chart of the Day – Initial Claims vs Prior Recessions
Bespoke’s Morning Lineup – 5/11/23 – Claims High; PPI Low
See what’s driving market performance around the world in today’s Morning Lineup. Bespoke’s Morning Lineup is the best way to start your trading day. Read it now by starting a two-week trial to Bespoke Premium. CLICK HERE to learn more and start your trial.
“A bank is a place where they lend you an umbrella in fair weather and ask for it back when it begins to rain.” – Bob Hope
Below is a snippet of content from today’s Morning Lineup for Bespoke Premium members. Start a two-week trial to Bespoke Premium now to access the full report.
After a slug of economic data, equity futures remain biased towards the downside along with treasury yields. Initial jobless claims came in higher than expected, continuing claims were modestly below estimates, headline PPI was weaker than expected, and core PPI was in line with expectations. Headline producer prices are currently up 2.3% on a y/y basis which is right in line with where this reading was in 2018 and 2019. Investors can debate over whether or not the FOMC should be cutting rates later this year, but given the continued weaker trend of data and stress in the banking sector, any continuation of rate hikes in June would be completely out of touch.
It was nice for a few days when headlines surrounding the regional banks weren’t at center stage, but PacWest ended the intermission this morning when it announced that nearly 10% of deposits at the bank left last week when news surfaced that the bank was evaluating strategic alternatives. Shares are down over 20% this morning and dragging other regional banks down with it.
While the banks may have been out of the headlines for a few days, the selling hadn’t stopped. Yesterday, the SPDR Regional Banking ETF (KRE) had its second-lowest close of the year trailing only the level it closed at last Thursday (5/4). In pre-market trading this morning, KRE isn’t quite below that close from a week ago, but it is within 20 cents of that low close ($36.08).

Shares of KRE have come nearly full circle from their COVID lows in early 2020. What’s interesting to note is that after the decline in the COVID crash in 2020, most investors probably thought they would never see regional banks decline that swiftly and with that magnitude ever again, but looking at the chart below, just three years later, history pretty much repeated itself.

Start a two-week trial to Bespoke Premium to read today’s full Morning Lineup.
Chart of the Day – Historical Declines in Headline CPI
Bespoke’s Morning Lineup – 5/10/23 – Under 5
See what’s driving market performance around the world in today’s Morning Lineup. Bespoke’s Morning Lineup is the best way to start your trading day. Read it now by starting a two-week trial to Bespoke Premium. CLICK HERE to learn more and start your trial.
“The higher up you go, the more mistakes you are allowed. Right at the top, if you make enough of them, it’s considered to be your style.” – Fred Astaire
Below is a snippet of content from today’s Morning Lineup for Bespoke Premium members. Start a two-week trial to Bespoke Premium now to access the full report.
As expected, Congressional leaders made little headway on the debt ceiling and then blamed each other for the stalemate. Given the low expectations, the market reaction was muted. Plus, investors have bigger fish to fry with the release of the April CPI which was expected to increase 0.4% on a m/m basis at both the headline and core levels. On a y/y basis, the headline level was expected to increase by 5.0%, while the core was forecast to increase by a more concerning 5.5%. The actual readings came in right in line with expectations although the headline y/y reading was slightly lower at 4.9%.
Equity futures were modestly lower heading into the report, following the lead of Asia and Europe, while treasuries were mixed, and crude oil was lower trading at $73 per barrel. Investors were clearly positioned for a hot reading, so the initial reaction from the market has been for equities and bonds to reverse their pre-market losses as the two-year yield drops back below 4%.
Semiconductors are an area of the market to watch here. After a lousy April where the Philadelphia Semiconductor Index (SOX) fell 7.3%, the index is down about another 1% so far in May, and the technical picture doesn’t look so great. The index broke below its 50-day moving average (DMA) in the middle of April and hasn’t been able to reclaim that level ever since. Not only that, but the SOX also broke its uptrend from the October lows. Last week, it tried to trade back above both its former uptrend and the 50-DMA but was rejected. Subsequently, last Friday it made another attempt at the 50-DMA but failed again. The S&P 500 has been having its own problems trading back above 4200, and unless the semis can regain their March traction, it could be a tough grind. On any downside in the SOX, the first level of support comes into play at around 2,850 (blue line) or about 3.5% below current levels.

Start a two-week trial to Bespoke Premium to read today’s full Morning Lineup.
Chart of the Day – Housing Market Hotness
Bespoke’s Morning Lineup – 5/9/23 – Less Confidence
See what’s driving market performance around the world in today’s Morning Lineup. Bespoke’s Morning Lineup is the best way to start your trading day. Read it now by starting a two-week trial to Bespoke Premium. CLICK HERE to learn more and start your trial.
“No one knows what interest rate the market would set, it’s always being manipulated.” – William Dunkelberg, NFIB
Below is a snippet of content from today’s Morning Lineup for Bespoke Premium members. Start a two-week trial to Bespoke Premium now to access the full report.
After Friday’s surge didn’t have much in the way of follow-through yesterday, bears have the upper hand this morning as futures are decidedly weaker, and treasury yields are lower (although they’re pretty much exactly where they were at this point yesterday morning). Investors will also be looking ahead to this afternoon’s meeting between the President and leaders of Congress over the debt ceiling. Expectations are low, but you never know. The fact that the President and his advisers are willing to meet after already saying they wouldn’t negotiate, is a small sliver of hope.
The performance of individual stocks grouped by market cap has been interesting to watch this year and for now, has laid to waste the notion that big things come in small packages. The chart below summarizes the average YTD performance of stocks in various major US indices, and while it may look at first like it’s sorted left to right from best to worst, it’s actually by the market cap of stocks that each index represents from largest to smallest. On the left, are the Nasdaq 100 and S&P 100 which are comprised of US mega-caps. The average YTD performance of Nasdaq 100 stocks has been a gain of 11.45% while the 100 components of the S&P 100 are up an average of 4.93% YTD. Broadening out a little bit to the large-cap S&P 500, the average YTD return of those stocks has been a gain of 2.58%.
Stepping down the market cap ladder from large caps, the average YTD return of mid-cap stocks in the S&P 400 has been a gain of 2.13%. Finally, at the bottom rungs, we have small and microcap stocks which are the only two of the six indices shown where the average YTD return is negative (-1.89% for stocks in the S&P 600 and -0.28% for stocks in the Russell Microcap index). It’s at these last two indices where the progression of performance getting incrementally weaker also breaks down.

Given its outperformance YTD, it shouldn’t come as a surprise that the Nasdaq 100 is closer to a 52-week high than any of its peers. The index has essentially been rangebound since a breakout on March 31, but after last Friday’s surge and Monday’s follow-through, it’s making its best effort to break out again. Based on where futures are trading this morning, it doesn’t look like it’s going to happen today, but a lot can change over the course of a few hours, and Wednesday’s CPI will most certainly have a say in how things play out.

Start a two-week trial to Bespoke Premium to read today’s full Morning Lineup.
The Triple Play Report — 5/9/23
An earnings triple play is a stock that reports earnings and manages to 1) beat analyst EPS estimates, 2) beat analyst sales estimates, and 3) raise forward guidance. You can read more about “triple plays” at Investopedia.com where they’ve given Bespoke credit for popularizing the term. We like triple plays as an indication that a company’s business is firing on all cylinders, with above-expectations results and an improving outlook. A triple play is indicative of positive “fundamental momentum” instead of pure fundamentals, and there are always plenty of names with both high and low valuations on our quarterly list.
Bespoke’s Triple Play Report highlights companies that have recently reported earnings triple plays, and it features commentary from management on triple-play conference calls, company descriptions and analysis, and price charts. Bespoke’s Triple Play Report is available at the Bespoke Institutional level only. You can sign up for Bespoke Institutional now and receive a 14-day trial to read this week’s Triple Play Report, which features seven stocks. To sign up, choose either the monthly or annual checkout link below:
Bespoke Institutional – Monthly Payment Plan
Bespoke Institutional – Annual Payment Plan

One of the sixteen triple plays featured in our newest report is Manhattan Associates (MANH). MANH has definitely been one of the most consistent reporter of triple plays over the last few years, and its share price is now just 8% below its late 2021 all-time highs after rallying just over 50% from its lows last November.

Manhattan Associates provides software solutions and services to help businesses optimize their supply chain, inventory, and omnichannel operations. Their products include tools for warehouse management, transportation management, order management, and customer engagement, among others. This name has tailwinds as both an infrastructure and an “automation” play. As shown below in the snapshot for MANH in our Earnings Explorer, revenues have re-accelerated to new highs in the last couple of years, even through last year’s bear market for stocks.
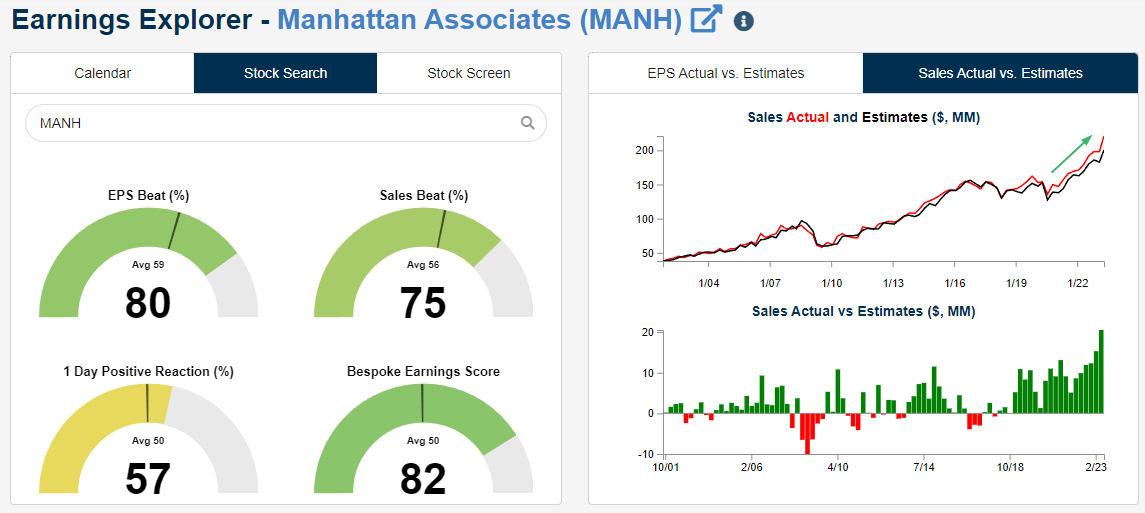
In terms of triple plays, MANH has now reported five in a row and 11 in its last 17 earnings reports, with EPS and revenue beats 17 quarters in a row as well.

For a full analysis of all 16 Tech-sector triple plays featured in this report, simply sign up for a Bespoke Institutional trial today and then read on!
Bespoke Investment Group, LLC believes all information contained in these reports to be accurate, but we do not guarantee its accuracy. None of the information in these reports or any opinions expressed constitutes a solicitation of the purchase or sale of any securities or commodities. This is not personalized advice. Investors should do their own research and/or work with an investment professional when making portfolio decisions. As always, past performance of any investment is not a guarantee of future results. Bespoke representatives or clients may have positions in securities discussed or mentioned in its published content.