Q2 2026 Earnings Conference Call Recaps: Oracle (ORCL)
Bespoke’s Conference Call Recaps use AI to summarize lengthy earnings calls. The commentary below is AI-generated and then edited by Bespoke for quality control. As always, none of these summaries should be construed as recommendations to buy or sell any securities, and investors should do their own research and/or consult with a financial professional before making any investment decisions.
Our latest recap available to Bespoke subscribers covers Oracle’s (ORCL) Q4 2026 earnings call.
![]()
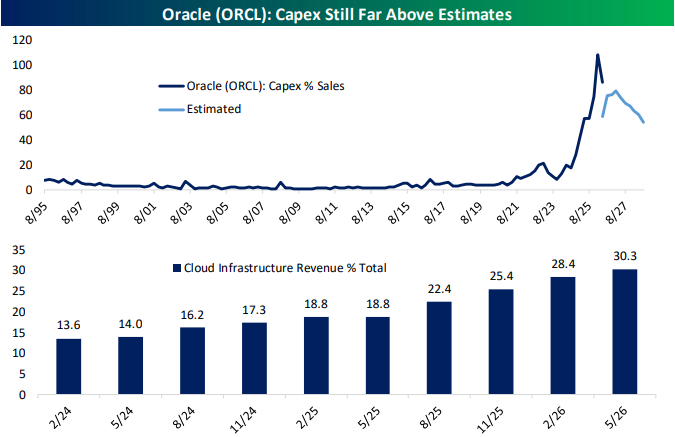
Oracle (ORCL) is one of the world’s largest enterprise software and cloud computing companies, selling the software, databases, and cloud infrastructure that large organizations use to run their operations. While Oracle is best known for its database business, the company has become an important player in cloud computing and AI because so much enterprise data already sits on Oracle systems. That gives Oracle a view into where companies are actually spending on AI and how quickly those projects are moving from testing to real-world deployment. Oracle’s quarter was dominated by one theme: demand for AI computing power is growing faster than the industry can build it. Cloud infrastructure revenue jumped 93%, while the company’s backlog of signed but unrecognized business reached $638 billion, up 363% year-over-year. Oracle signed $67 billion of new AI infrastructure contracts during the quarter and said customers continue to commit billions of dollars years in advance, often prepaying or supplying their own hardware to secure capacity. To keep up, Oracle plans to spend roughly $70 billion on data center expansion in fiscal 2027 and expects to bring significant new capacity online throughout the year. Outside of infrastructure, management said customers have largely moved beyond AI experimentation and are now deploying AI agents inside business software to automate tasks like recruiting, customer service, and healthcare workflows. Despite better-than-expected revenue and EPS, ORCL shares opened 11.2% lower on 6/11…
Continue reading our Conference Call Recap for ORCL by becoming a Bespoke Institutional subscriber. You can sign up for Bespoke Institutional now and receive a 14-day trial to read our newest Conference Call Recap. To sign up, choose either the monthly or annual checkout link below:
Chart of the Day: RIP Tokenmaxxing, We Hardly Knew Ye
Bespoke’s Morning Lineup – 6/11/26
See what’s driving market performance around the world in today’s Morning Lineup. Bespoke’s Morning Lineup is the best way to start your trading day. Read it now by starting a two-week trial to Bespoke Premium. CLICK HERE to learn more and start your trial.
“Stocks? We don’t have those Enron-type connections.” – Tony Soprano

Below is a snippet of commentary from today’s Morning Lineup. Start a two-week trial to Bespoke Premium to view the full report.
Start a two-week trial to Bespoke Premium to continue reading today’s full Morning Lineup.
The Closer – SpaceX, Corporate Bonds, CPI – 6/10/26
Log-in here if you’re a member with access to the Closer.
- While Oracle (ORCL) capex appears to have peaked, it still came in at 86% of revenues.
- The recent selloff in equity indices has helped push the forward P/E ratio of the S&P 500 back down to 20.2x, or just below 5% forward earnings yield.
- Petroleum stockpiles continue to rapidly unwind, especially for strategic reserves that are now only 2.4 mm bbls above the July 2023 low.
See today’s full post-market Closer and everything else Bespoke publishes by starting a 14-day trial to Bespoke Institutional today!
Chart of the Day – Warsh Begins
Tech Takes a Hit
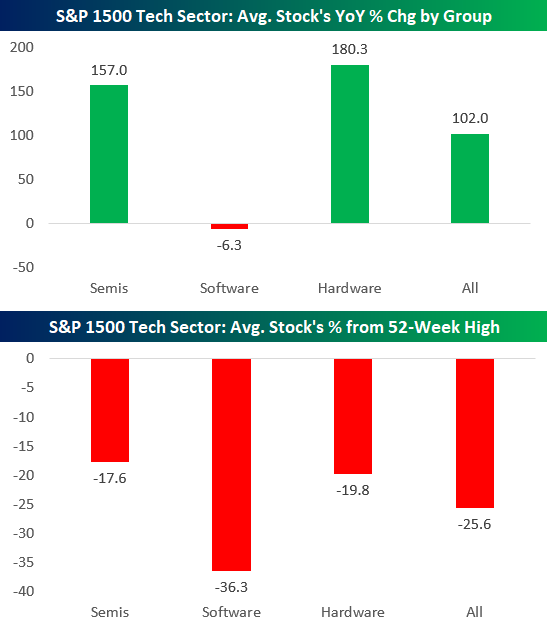
Even after the recent pullback in Tech, the average S&P 1500 Tech stock is up over 100% year-over-year. If you’ve been paying attention, though, not all groups within Tech have done well.
As shown in the first chart below, the average semiconductor and hardware stock in Tech is up 150%+ y/y, but the average software stock is actually down 6%.
After the selloff over the past week or so, the average Tech stock is sitting 25% below 52-week highs.
As shown in the second chart below, the average software stock is down 36%, while the average semiconductor and hardware stock is still less than 20% off 52-week highs.
So which stocks that had been doing pretty well have gotten hit hardest this month?
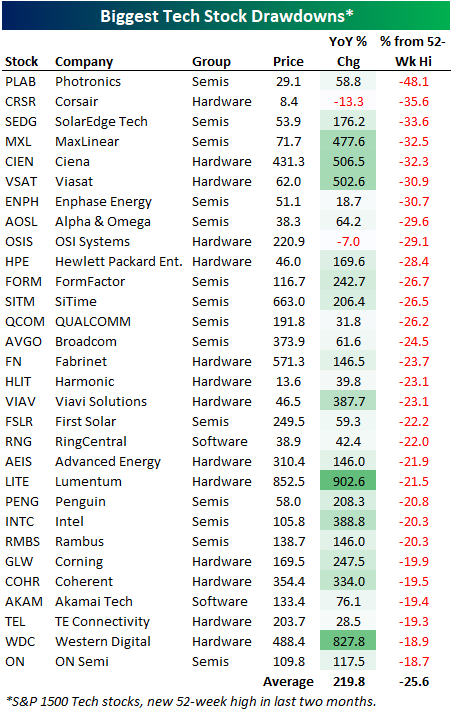
We looked at the 100+ Tech stocks in the S&P 1500 and then filtered for ones that have made 52-week highs in the last two months. Below are the 30 stocks from this group that are now the farthest below those recent 52-week highs.
Some of the hardest hit names are semis and hardware stocks like SolarEdge (SEDG), Max Linear (MXL), Ciena (CIEN), and Viasat (VSAT), which are all now 30% below 52-week highs. Even after the sharp drops, these four stocks are still up 100%+ y/y, with CIEN and VSAT still up 500% y/y!
Want more from Bespoke? You can start by joining our Think BIG mailing list where you’ll receive an interesting market stat in your inbox a few times per week. All we need is your email address. Join now by clicking here or on the image below.

Raining on the Russell 1000’s Parade
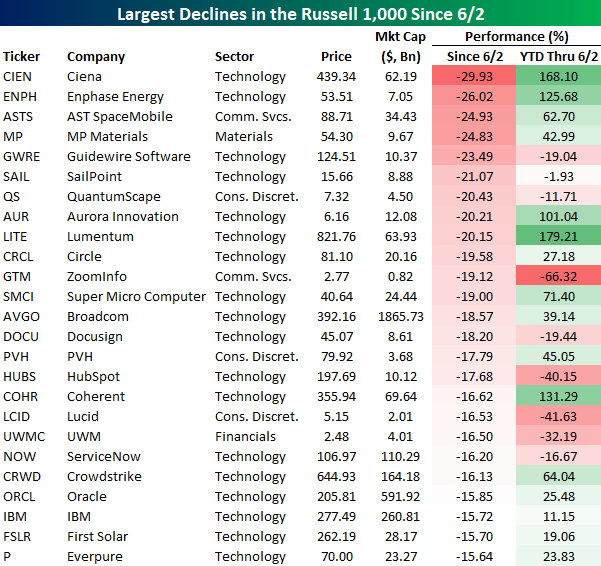
The Russell 1,000 is down more than 3% since its June 2nd high, but several of its biggest losers have lost more than a fifth of their value. In just a week, Ciena (CIEN) has tumbled almost 30%, making it the biggest loser in the index after an 168% upswing on the year before the 6/2 close. Enphase Energy (ENPH), AST SpaceMobile (ASTS), MP Materials (MP), Guidewire Software (GWRE), SailPoint (SAIL), QuantumScape (QS), Aurora Innovation (AUR), and Lumentum (LITE) are the other eight names that have fallen at least 20% over the past week.
On average, the 25 stocks below rallied 35.5% on the year before last week’s peak, but they’re all down at least 15% since. For nine companies, the losses over the past week add to an already rough 2026. For three of those companies, GWRE, SAIL, and QS, the losses over the past week are even worse than the YTD losses leading up to the 6/2 Russell 1,000 peak.
Want more from Bespoke? You can start by joining our Think BIG mailing list where you’ll receive an interesting market stat in your inbox a few times per week. All we need is your email address. Join now by clicking here or on the image below.
Bespoke’s Morning Lineup – 6/10/26 – Truth Be Told
See what’s driving market performance around the world in today’s Morning Lineup. Bespoke’s Morning Lineup is the best way to start your trading day. Read it now by starting a two-week trial to Bespoke Premium. CLICK HERE to learn more and start your trial.
“I believe in the idea of the rainbow. And I’ve spent my entire life trying to get over it.” – Judy Garland
Below is a snippet of commentary from today’s Morning Lineup. Start a two-week trial to Bespoke Premium to view the full report.
US stocks are down and bond yields up ahead of the open after President Trump suggested on Truth Social that the US will resume bombings of Iran. Leading up to Trump’s comments, futures were already pointed lower, however, led by Tech.
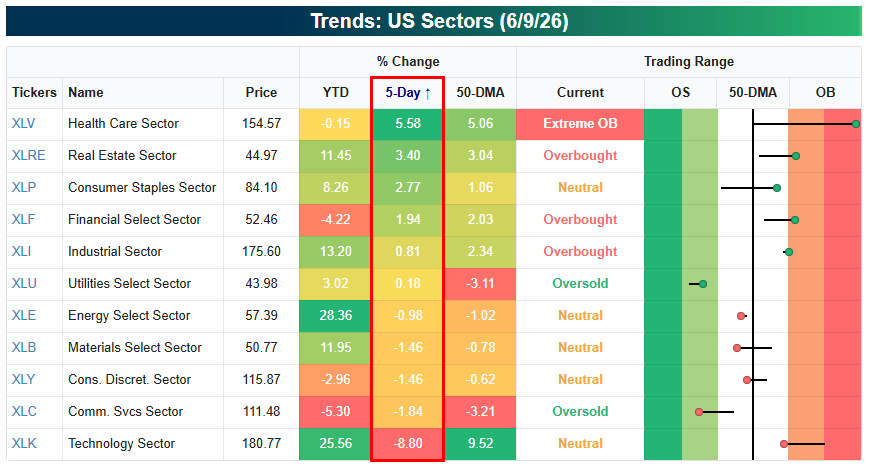
It’s important to note that we’re seeing rotation within the market rather than out of the market. Yes, the broad indices are down because of Tech’s large weighting, but we’ve seen nice gains for sectors like Health Care, Real Estate, Consumer Staples, and Financials as Tech has been selling off.
Start a two-week trial to Bespoke Premium to continue reading today’s full Morning Lineup.
The Closer – Tech Tumble, Breadth Disconnects, Trade – 6/9/26
Log-in here if you’re a member with access to the Closer.
- Tech has experienced a painful 5-day selloff that has taken it down 8.9% off of its high one week ago.
- Price and breadth were disconnected once again with today marking the 37th time this year that price and breadth moved in opposite directions.
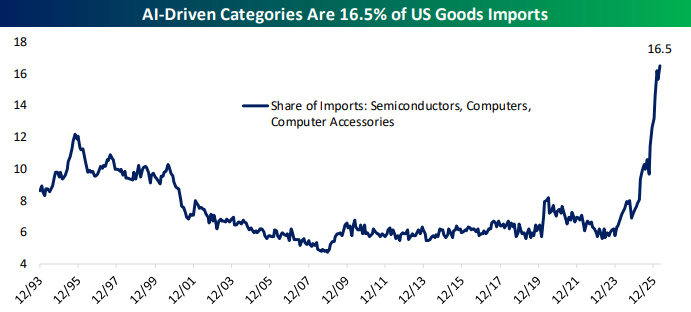
- AI-linked categories of imports continue to rise exponentially; accounting for 16.5% of total goods imports in April
See today’s full post-market Closer and everything else Bespoke publishes by starting a 14-day trial to Bespoke Institutional today!