
Bespoke Report – 11/6/26 – Liquid-AI-tion
To read our weekly Bespoke Report newsletter and access everything else Bespoke’s research platform offers, choose one of our three member plans today!
It was another painful showing for the AI trade this week. A massive blow-out midterms win, hedge fund pain, earnings results, jobs day, and every angle of the massive pain felt in stocks this week are all covered in The Bespoke Report.


Mega-Cap Default Risk Update
Last month, we began tracking default risk for the mega-caps by creating an index that tracks the price change in their credit default swaps (CDS).
A few years ago, the mega-caps were swimming in cash, but not anymore. The AI Boom has pushed these Tech behemoths to take on massive debt to fund their AI ambitions and defend their moats.
Because of the debt raises, credit default swaps (CDS) have begun trading on these names. Corporate bond owners can buy CDS to hedge against default, while institutional investors who think the AI trade has run ahead of itself can buy CDS to profit if they’re right. CDS prices go up when default risk increases.
The mega-caps as a group fell sharply this week along with the rest of the market. Below is a look at how much default risk rose as stock prices fell.

While the ten mega-caps in our index fell 5% this week, our CDS index tracking them only rose about 1.7%.
Below is a look at which mega-caps saw default risk rise and fall. Tesla (TSLA), SpaceX (SPCX), Oracle (ORCL), Broadcom (AVGO), and Amazon (AMZN) were the five that saw CDS prices rise, while Meta (META), Microsoft (MSFT), Apple (AAPL), NVIDIA (NVDA), and Alphabet (GOOGL) actually saw default risk dip a bit.

In terms of stock performance, Amazon (AMZN) actually did the best this week even though its default risk rose a bit, while NVIDIA (NVDA) fell 11.3% even though its default risk also fell.

You can monitor our mega-cap CDS index and everything else going on in big Tech and AI with a Bespoke Premium membership. Click here to start a 30-day trial.


4%+ Declines After a Flat to Higher Open
Bespoke’s Morning Lineup – 11/6/26 – Blockbuster Jobs Report
See what’s driving market performance around the world in today’s Morning Lineup. Bespoke’s Morning Lineup is the best way to start your trading day. Read it now by starting a two-week trial to Bespoke Premium. CLICK HERE to learn more and start your trial.
“Always bear in mind that your own resolution to succeed is more important than any other one thing.” – Abraham Lincoln
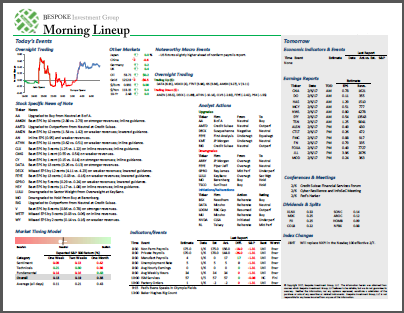
Below is a snippet of commentary from today’s Morning Lineup. Start a two-week trial to Bespoke Premium to view the full report.
That was painful. After one of the more brutal days in memory for tech stocks, US futures are attempting to rebound this morning, but there’s not a lot of conviction behind the trade. S&P 500 futures are flat, and the Nasdaq is trading 1.2% higher but off its morning highs. Treasury yields are moving higher, with the 10-year yield at 4.87%; crude oil is slightly higher at just over $90 per barrel for WTI. Meanwhile, gold is down over 1% while Bitcoin is slightly lower.
Overnight, Asian stocks fell sharply with both the Nikkei and Kospi down over 5% as those markets catch up to the carnage in US tech stocks yesterday. In Europe, it’s a similar story. While there’s much less exposure to tech over there, indices in the region are down at least 1.5% as they play catch-up to the weakness in US stocks yesterday afternoon.
The October Employment report just hit the tape, and while that would usually be the focus of investor attention, investors and traders have bigger issues to focus on right now. That being said, the report was a blockbuster. Nonfarm payrolls exceeded forecasts by nearly 100K at 165K, average hourly earnings increased 0.4% versus forecasts for 0.3, and the Unemployment Rate ticked down to 4.1%
The Philadelphia Semiconductor Index (SOX) had the second worst day in its history yesterday, falling 12.2%. While there were six other days when the index had a one-day decline of at least 10%, the only day that was worse was on 3/16/2020 when it fell 15.9% in a single day. It’s not hyperbole to say yesterday’s decline was historic.
There are several ways you can look at the declines in the SOX. Yes, yesterday’s decline was historic, and the index is now firmly below its 50- and 200-day moving averages. Despite the sharp decline, though, it’s only back to levels it was at in early April and is up 19% since the end of Q1. If someone told you on 3/31 that you would earn a 19% return on your investment in just over seven months, you would have taken it without hesitation, but when that performance follows what was a 93% gain from 3/31 to the summer high, it doesn’t look nearly as good. In marketing, they call this positioning.

As of yesterday’s close, the SOX is down just over 38% from its summer high. As the chart below illustrates, only five other drawdowns from an all-time high exceeded the current decline. One was the 87% plunge from the dot-com peak, but the others were all between 39.7% (the most recent one in 2025) and 53%. If we’re in for a repeat of the dotcom bust, there would be a lot more pain ahead, as it would take an additional decline of 79% to match that drop.
Relative to the other drawdowns, it would seem as though the worst is behind the semis. In the case of the 2025 drawdown, it would only take another 2% to match that drop, but to match the decline of the 2022 bear market, the SOX would need to fall another 13%, while it would take a decline of about 23% to reach the magnitude of the drawdowns the SOX experienced in 1996 and 1998. These aren’t targets, just reference points.

In addition to having its second worst day on record yesterday, the drop also capped a five-day decline of 21.8% for the SOX. In the index’s history, there have been five other periods when semis had a five-day decline of at least 20% and another in March 2020 when it got very close (19.7%). Four of them were during the dotcom bust and the fifth was during the depths of the Financial Crisis.

While these weren’t necessarily great times for the stock market, the almost 20% drop in March 2020 and the 20.4% decline in November 2008 presented generational buying opportunities.

Start a two-week trial to Bespoke Premium to continue reading today’s full Morning Lineup.
The Closer – Pain and Vol, Oversold Swing, Road to 60 – 11/5/26
Log-in here if you’re a member with access to the Closer.
- Price action today reflected rotation in and out of the past month’s winners and losers as much as a reaction to the election.
- AI infrastructure stocks had a historically weak day in response to the midterms including our Picks and Shovel basket tying its second worst day since the release of ChatGPT.
- Front month WTI has collapsed over 14% in the past three days alone, and is now testing support at its long term moving average.

See today’s full post-market Closer and everything else Bespoke publishes by starting a 14-day trial to Bespoke Institutional today!
4%+ One-Day Drops
The S&P 500 closed down 4.36% today for its worst day since April 4th, 2025, the 2nd day of a two-day crash from the Tariff Tantrum.
Red dots in the log chart of the S&P 500 below show the 56 prior one-day drops of 4% or more for the index since 1952.

In case you’re wondering, below is a look at the S&P’s average percentage change in the days, weeks, and months following the 56 prior 4%+ one-day drops. Of course, past performance is no guarantee of future results, but historically, the index has averaged a gain of 2% over the next month and 6.7% over the next three months. If you’re not yet a Bespoke subscriber, start a 30-day trial for more analysis of current market dynamics to help keep you grounded.

Chart of the Day: AI Trade Car Crash
Homebuilders Make Up Ground Quickly
The iShares US Home Construction ETF (ITB) jumped more than 7% yesterday, bringing its five-day gain to 12.7%, the largest since July 2024. A week ago, ITB and the SPDR S&P Homebuilders ETF (XHB) both traded below their 50-day moving averages. Both are now extremely overbought, along with eight other names in the snapshot below. Builders FirstSource (BLDR) moved from below its 50-day moving average to extremely overbought (2+ standard deviations above the 50-DMA) after a 24.4% gain in five days, and NVR went from oversold to overbought over the same stretch with a 10.1% gain. Cavco Industries (CVCO) has led the way, up 27.44% over the last five days.

Yesterday’s rally took ITB back above its 200-day moving average for the first time since August and through the short-term downtrend that started earlier this year. ITB closed at $100.30, putting it within about 4% of $104, the level it would need to clear to break the longer downtrend from its pre-election peak in 2024.

The SPDR S&P Homebuilders ETF (XHB) also closed back above its 200-day moving average after gaining 9.8% over the last five trading days, but still has some work to do before it breaks its downtrend. Both ETFs are now up just over 4% year-to-date, which gives you a sense of how quickly the past week erased their year-to-date losses.

AI Infrastructure Free Fall
Polls are closed, election results are in, and so too are exit polling data. While not necessarily the most in focus issue on ballots, anti-data center/AI rhetoric was prevalent during the election. As we highlighted in last night’s Closer among a number of other topics surrounding the election, NBC exit polling showed voters who said AI data centers mattered more to their congressional vote leaned Democratic: 69% of those calling it “crucial” voted Democratic and 62% of those saying it was a “major factor” voted Democrat. In total, 56% of all voters polled reported it to be a major or crucial factor. In other words, AI build-out to some degree has become a politicized issue divided among party lines.

Given that propensity for Democrat voters to see AI as a bigger concern, the AI trade had a rough day in response to the blue wave. Our overall AI basket fell over 1% yesterday with split performance between the Infrastructure (-4.15%) and Implementation (+1.9%) sub-baskets. As shown below, that was one of the widest divergences between daily performance of our AI Infrastructure and AI Implementation sub-baskets since the start of 2023. Only a handful of other days recently have similarly seen as large of splits, but before this year, Liberation Day was the only comparable session.
Today, losses are accelerating with the Infrastructure basket down another 6.56%, the fifth daily decline of the past six sessions. Furthermore, the technical damage has been done to the group. As shown below, since Q1 our Infrastructure basket has been trending sideways that included a double top of June and October highs and a low set in late July. Those lows have been taken out now and the group is nearing a 30% drawdown from its all time high set in June.

Bespoke’s Morning Lineup – 11/5/26 – Tech Still Lags
See what’s driving market performance around the world in today’s Morning Lineup. Bespoke’s Morning Lineup is the best way to start your trading day. Read it now by starting a two-week trial to Bespoke Premium. CLICK HERE to learn more and start your trial.
“There’s no system to avoid bad markets. You can’t do it unless you try to time the market, which is a seriously dumb thing to do.” – Charlie Munger
Below is a snippet of commentary from today’s Morning Lineup. Start a two-week trial to Bespoke Premium to view the full report.
According to weeks of nonstop political ads, life as we know it would end if you voted the wrong way yesterday. People voted both ways, and yet the sun still came up for everybody (even if you chose not to go out and look). Life goes on.
It’s looking like another mixed session for US stocks today. The S&P 500 is barely hanging on to gains while the Nasdaq is sharply lower, facing a loss of nearly 1%. The key driver behind the weakness is an unwind of the AI trade, as semiconductor and memory stocks drag the index lower. Treasury yields are slightly higher, with the 10-year yield at 4.90%, and crude oil is bouncing more than 2% and getting back near $90 per barrel. Gold is continuing its rally from yesterday with a gain of over 1%, while Bitcoin is falling back below $80K.
Asian markets didn’t share much of the optimism US stocks enjoyed yesterday. The Nikkei fell another 1.8% while the Kospi declined more than 5%. Chinese stocks fared better, though, with onshore stocks trading slightly higher while Hong Kong’s Hang Seng surged 3.7%. The main driver to the downside was weakness in semis, while China’s government support of the equity market through ETF purchases provided support. In Hong Kong, strength in Asian internet/AI powerhouses like Alibaba and Tencent supported that market.
Like yesterday, European stocks are rallying even as Asia had mixed results. The STOXX 600 is up 0.5%, led higher by Spain with a 1.4% gain while Italy lags with a 0.3% gain. The big mover in the region today is Rheinmetall, which is down over 15% after lowering guidance. In the UK, the BoE raised rates 25 bps to 4.0%, a move that was widely expected.
The US economic calendar is relatively busy today with Nonfarm Productivity, Unit Labor Costs, and Jobless Claims all hitting the tape at 8:30 ET. Productivity was stronger than expected while jobless claims and Unite Labor Costs were lower than expected. There are also several Fed speakers on the schedule throughout the day, so it will be interesting to hear their commentary in the wake of the midterm elections.
Yesterday’s performance in the equity market had a lot of dramatic moves. In the S&P 1500, for example, 50 stocks fell more than 10% on the day while 44 rallied more than 10%. More than 90 stocks in the S&P 1500 making moves that large stands out on its own, but they were also almost evenly split between gainers and losers. Normally, when you see a lot of large individual moves, they tend to be one-sided in the direction of the market that day. For example, on a big up day you would expect to see a lot of big gainers and vice versa for a big down day. That’s what makes yesterday even crazier, though; the S&P 500 was up over 1%, and there were more 10% losers than gainers!
The large number of big movers suggests the market was surprised by the results of the election. If the market was surprised, though, it wasn’t that the Democrats swept the House and Senate; it was that they won by so much. As noted in last night’s Closer, the 50 S&P 500 stocks that performed the best leading up to Election Day were up an average of 5.3% yesterday, while the stocks down the most in the month before Americans went to the polls declined an average of 6.9%. In other words, the market simply pressed bets that were already in place.

To a smaller degree, yesterday’s performance was also a reversal of the trend that followed the 2024 election when President Trump was re-elected. The chart below groups S&P 500 stocks based on how they performed in the month after the 2024 election. The 50 stocks that performed the worst after Trump’s re-election rallied an average of 2.4% yesterday, while the two deciles of best performers after the 2024 election were the only two that averaged gains of less than 1% yesterday.

One group that saw some large moves yesterday was the homebuilders. The iShares Home Construction ETF (ITB) rallied more than 7%, taking its five-day gain to nearly 13%, the largest gain over that span since July 2024. With the gain, ITB closed above its 200-day moving average for the first time since August, and it broke a short-term downtrend dating back to early this year in the process.

While the short-term technical picture for ITB has improved, the longer-term picture still has some work to do. As shown in the chart below, the downtrend from ITB’s peak just before the 2024 election (see what we mean by a reversal of the Trump re-election trade) remains firmly intact, and it would take a rally above $104 to convincingly break that downtrend.

Start a two-week trial to Bespoke Premium to continue reading today’s full Morning Lineup.