
The Bespoke 50 Growth Stocks — 8/4/22
The “Bespoke 50” is a basket of noteworthy growth stocks in the Russell 3,000. To make the list, a stock must have strong earnings growth prospects along with an attractive price chart based on Bespoke’s analysis. The Bespoke 50 is updated weekly on Thursday unless otherwise noted. There were seven changes to the list this week.
The Bespoke 50 is available with a Bespoke Premium subscription or a Bespoke Institutional subscription. You can learn more about our subscription offerings at our Membership Options page, or simply start a two-week trial at our sign-up page.

The Bespoke 50 performance chart shown does not represent actual investment results. The Bespoke 50 is updated weekly on Thursday. Performance is based on equally weighting each of the 50 stocks (2% each) and is calculated using each stock’s opening price as of Friday morning each week. Entry prices and exit prices used for stocks that are added or removed from the Bespoke 50 are based on Friday’s opening price. Any potential commissions, brokerage fees, or dividends are not included in the Bespoke 50 performance calculation, but the performance shown is net of a hypothetical annual advisory fee of 0.85%. Performance tracking for the Bespoke 50 and the Russell 3,000 total return index begins on March 5th, 2012 when the Bespoke 50 was first published. Past performance is not a guarantee of future results. The Bespoke 50 is meant to be an idea generator for investors and not a recommendation to buy or sell any specific securities. It is not personalized advice because it in no way takes into account an investor’s individual needs. As always, investors should conduct their own research when buying or selling individual securities. Click here to read our full disclosure on hypothetical performance tracking. Bespoke representatives or wealth management clients may have positions in securities discussed or mentioned in its published content.
Bespoke’s Weekly Sector Snapshot — 8/4/22
Viva Brazil? It Depends on the Currency
Equities in Brazil traded higher again today with the country’s benchmark Ibovespa index rallying over 2% and capping off a 15-day 11% rally where the index has only traded lower three times. Today’s rally also raised eyebrows among technicians as the Ibovespa, like a number of major US indices has broken its downtrend relative to the highs earlier this year. From a technical perspective, what’s not to like about Brazil?

One item may be the currency. Brazilian equities have broken their downtrend from the late March high, but from the perspective of a US investor, the weaker real means that the gains aren’t quite as impressive as they are down in Sao Paulo. After adjusting performance to account for the moves in currency markets, Brazilian equities have still rallied, but after today’s rally, they are only just now beginning to test the downtrend from spring highs. Don’t toast that Caipirinha just yet. Click here to learn more about Bespoke’s premium stock market research service.

Bulls Back Above 30%
While the rally has paused today, the S&P 500 has continued to press higher in the past week and is currently hovering near resistance at the late May/early June highs. In response to those moves, investor sentiment has improved with the weekly survey from the AAII showing over 30% of respondents reporting as bullish. That is the highest reading since the first week of June when the S&P 500 was at similar levels to now.

Bearish sentiment is a similar story in hitting the lowest level since the first week of June as it has fallen back below 40%. The further 1.2 percentage point drop marks the fourth week in a row that bearish sentiment has fallen, and the full decline since the recent high of 59.3% on June 23rd now sits at over 20 percentage points.

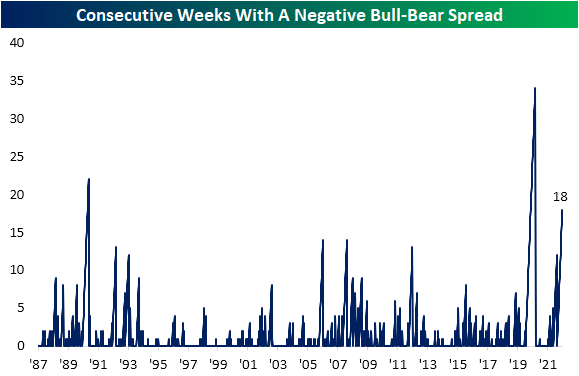
In spite of those further improvements, there continues to be more bears than bulls as the spread remains in negative territory. As shown in the second chart below, the bull bear spread has now been negative for 18 weeks in a row.

In addition to the drop in bearish sentiment, neutral sentiment was also lower falling 1.6 percentage points down to 30.6%. That is the first time neutral sentiment matched bullish sentiment since May of last year. Click here to learn more about Bespoke’s premium stock market research service.

Chart of the Day: Summer Rally Decile Analysis
Initial Claims Back to the Highs
Initial jobless claims came in matching expectations at 260K this week, up from last week’s downward revision of 254K. That reading leaves claims 1K below the pandemic high set two weeks ago. Those levels are above the pre-pandemic range and consistent with where claims stood in the fall of 2017.
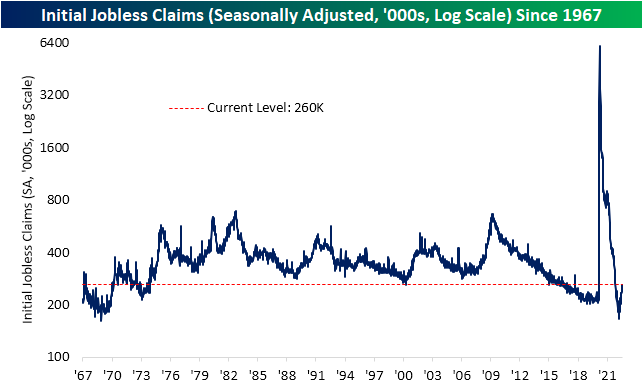
On a non-seasonally adjusted basis, claims have the benefit of seasonal tailwinds at this point of the year as the mid-summer peak works itself out. Given this, unadjusted claims have dropped to 205.6K from the high of 258.9K two weeks ago. Although that is a strong level of claims, it is above the readings from the comparable week of the year in 2018 and 2019.

Continuing claims are lagged an additional week to the initial claims number meaning the most recent reading is as of the week of July 22nd. Although initial claims had fallen that week, continuing claims moved back above 1.4 million for the first time since mid-April. Unlike initial claims, and as we will discuss further in tonight’s Closer, the deterioration in continuing claims has been relatively modest as current levels are not only well below levels from the two years pre-pandemic, but this week’s reading would still make for some of the best readings since 1970. Click here to learn more about Bespoke’s premium stock market research service.

Bespoke’s Morning Lineup – 8/4/22 – Fading into the Open
See what’s driving market performance around the world in today’s Morning Lineup. Bespoke’s Morning Lineup is the best way to start your trading day. Read it now by starting a two-week trial to Bespoke Premium. CLICK HERE to learn more and start your trial.
“Far and away the best prize that life offers is the chance to work hard at work worth doing.” – Theodore Roosevelt

Below is a snippet of content from today’s Morning Lineup for Bespoke Premium members. Start a two-week trial to Bespoke Premium now to access the full report.
Futures were higher earlier but have given up much of their gains as we head into the open. Initial Jobless Claims were just released and came in at 260K which is just 1K shy of a post-COVID high. Continuing Jobless Claims saw a larger increase hitting the highest levels since April. In the UK, the BoE raised rates by 50 bps which was the largest hike since 1995. What’s ironic about the move is that at the same time the central bank raised rates by the most in more than 25 years, it also warned of a long recession.
Today’s Morning Lineup discusses earnings and market news out of Europe and the Americas, rate hikes in Brazil and the UK, a look at LNG markets on news of a sooner-than-expected restart at the Freeport terminal, and much more.
Yesterday was the 58th time in 2022 that the Nasdaq experienced a one-day rally or decline of 2% or more, and it is only August 4th! To put that in perspective, we’re just under 150 trading days into the year, so at the current pace, we’re seeing an average of about two 2%+ daily moves per week! How does that stack up relative to history? Going back to 1971, even if there aren’t any more 2% moves for the rest of the year, 2022 would rank as the 6th highest number of 2% days in a calendar year in the Nasdaq’s history. That’s just four less than the total for 1999, 25 behind the total for 2008, but well more than 40 below the triple-digit totals seen in 2000, 2001, and 2002. The record for the greatest number of 2% days in a calendar year came in 2000 when the 2% threshold was crossed 134 times or more than once every other day.

2022 already ranks as the sixth highest number of 2% days in a calendar year in the Nasdaq’s history, but when we compare the number of 2% days this year through the end of July to the first seven months of all other years, it ranks as the third most. As shown in the chart below, the only two years that had more 2% daily moves YTD through 7/31 than 2022 (57) were 2000 (84) and 2001 (74). Other years that were close were 2002 (54) and 2009 (51).

Start a two-week trial to Bespoke Premium to read today’s full Morning Lineup.
The Closer – Megacaps, Manufacturing Indices, Gasoline Bunkers Overflow – 8/3/22
Log-in here if you’re a member with access to the Closer.
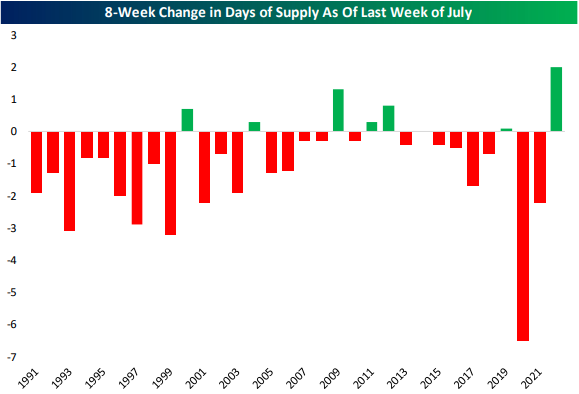
Looking for deeper insight into markets? In tonight’s Closer sent to Bespoke Institutional clients, after a rundown of tonight’s major earnings reports (page 1), we show the huge contribution of mega-cap stocks in the past month (page 2). We then review global PMIs with the addition of today’s services release (page 3 and 4). We then pivot to hard manufacturing data in the form of factory orders (page 5). We finish with the latest on petroleum stockpile data (page 6) and the the implications of a rising supply of gasoline on equity prices (page 7).
See today’s full post-market Closer and everything else Bespoke publishes by starting a 14-day trial to Bespoke Institutional today!
Daily Sector Snapshot — 8/3/22
Fixed Income Weekly: 8/3/22
Searching for ways to better understand the fixed income space or looking for actionable ideas in this asset class? Bespoke’s Fixed Income Weekly provides an update on rates and credit every Wednesday. We start off with a fresh piece of analysis driven by what’s in the headlines or driving the market in a given week. We then provide charts of how US Treasury futures and rates are trading, before moving on to a summary of recent fixed income ETF performance, short-term interest rates including money market funds, and a trade idea. We summarize changes and recent developments for a variety of yield curves (UST, bund, Eurodollar, US breakeven inflation and Bespoke’s Global Yield Curve) before finishing with a review of recent UST yield curve changes, spread changes for major credit products and international bonds, and 1 year return profiles for a cross section of the fixed income world.
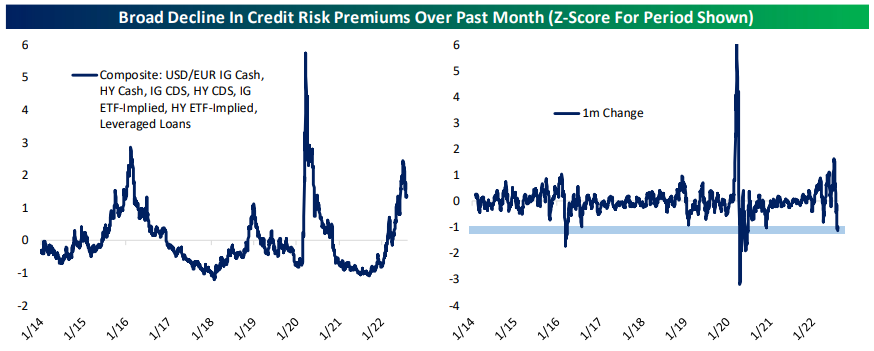
In this week’s report we discuss the differing signals being sent by credit and rates markets about the future policy trajectory.
Our Fixed Income Weekly helps investors stay on top of fixed income markets and gain new perspective on the developments in interest rates. You can sign up for a Bespoke research trial below to see this week’s report and everything else Bespoke publishes free for the next two weeks!
Click here and start a 14-day free trial to Bespoke Institutional to see our newest Fixed Income Weekly now!