
Daily Sector Snapshot — 8/16/22
Bespoke Stock Scores — 8/16/22
Biggest Gainers Since 6/16 Low
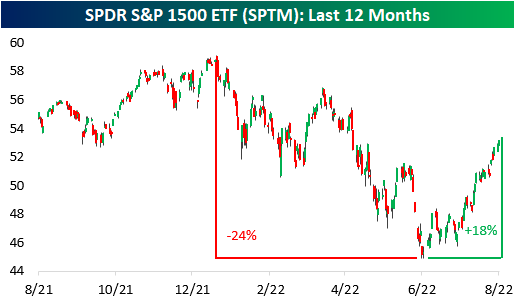
Today marks two months since the mid-June low. At the time, the S&P 1500 had declined 23.5% relative to the January 3rd high. Since then, the index has recovered substantially, gaining 17.7% off of the low. Although the S&P 1500 is still 10.0% off of its closing high, these gains have been well received by investors as the market has shown resilience in the face of rampant inflation, worsening housing data, rate hikes, supply chain constraints, and increased labor costs. This rally comes as oil prices pull back, CPI came in lower than estimated for the month of July, and earnings come in better than expected. The graph below shows the price moves in the SPDR S&P 1500 ETF (SPTM) over the last twelve months. Click here to start a two-week trial to Bespoke Premium and receive our paid content in real-time.
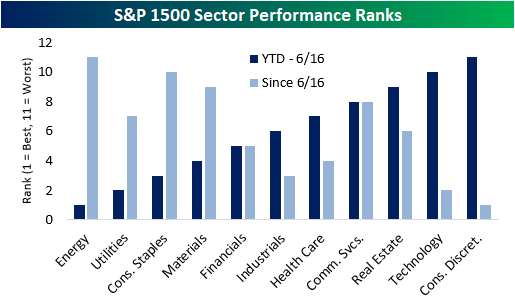
Since the June low, there has been a reversal in performance trends, as the laggards have tended to lead the way higher (on a percentage basis) while the former leaders have generally lagged. Between the start of the year and the 6/16 low, Energy and Utilities were the best performing sectors, while Technology and Consumer Discretionary were the worst. Since then, we have seen the inverse as Technology and Consumer Discretionary have been the top-performing sectors while Energy has been the worst.
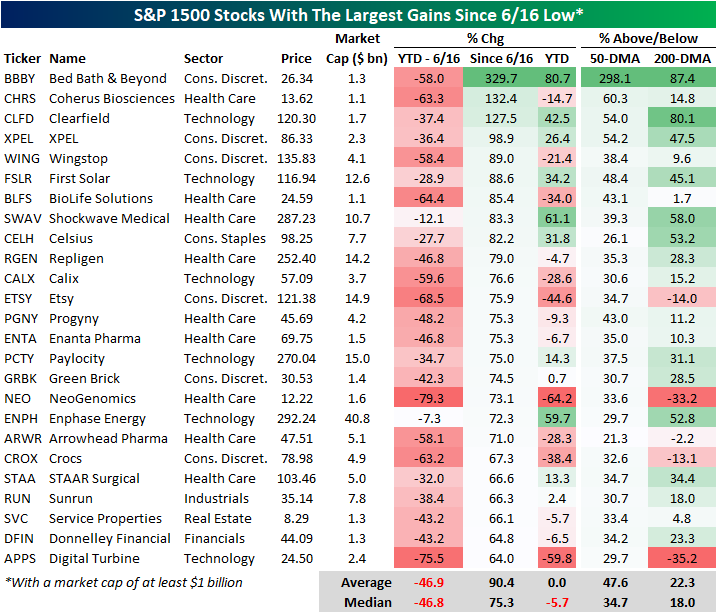
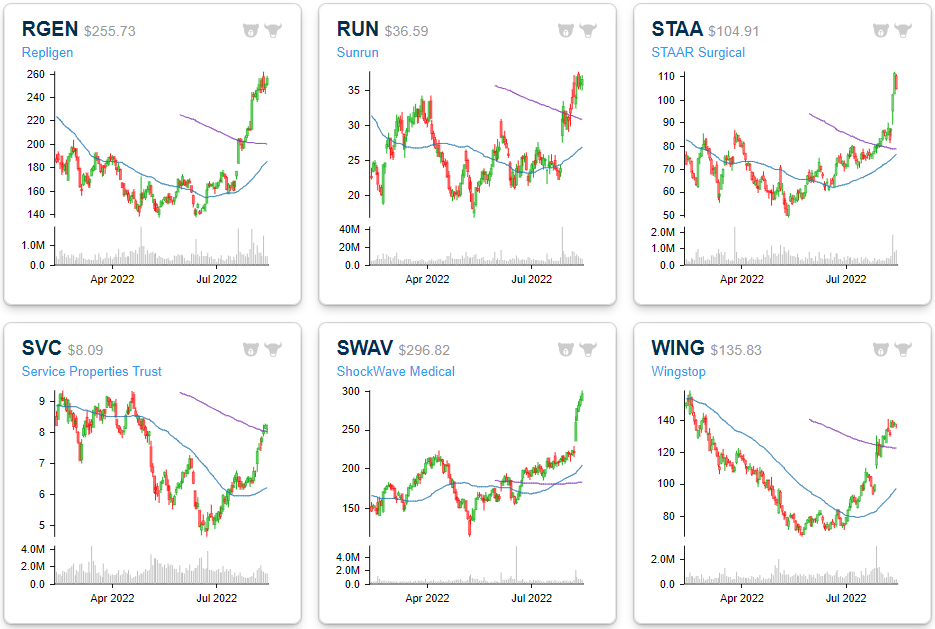
The chart below shows the 25 best-performing S&P 1500 stocks since the 6/16 low. As you can see, these stocks generally underperformed the broader index until the low, trading down by an average of 46.9%. However, since the lows, they are up an average of 90.4%, led by the newest meme stock: Bed Bath & Beyond (BBBY). Due to the drawdowns through 6/16, these stocks are still down YTD on a median basis (and even on an average basis), but they are an average of 47.6% above their 50-DMAs and 22.3% above their 200-DMAs. They’ve come a long way, and shown in the charts below, many have reached some extremely stretched levels, but even after the rallies, they still have a ways to go before coming out of the darkness. Click here to start a two-week trial to Bespoke Premium and receive our paid content in real-time.
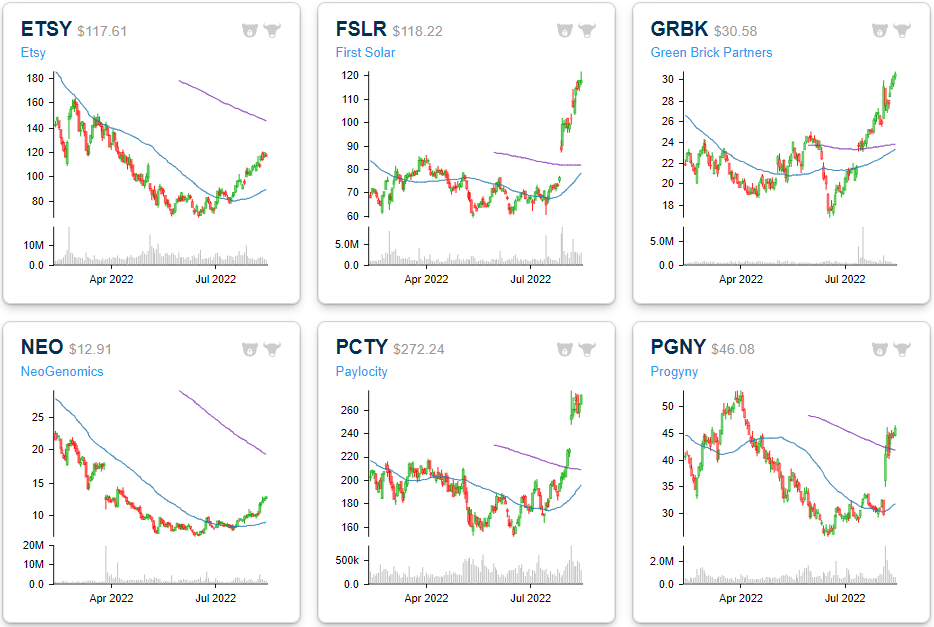
Six-month price charts for each of these stocks are included below. You can track a custom portfolio of these names by clicking here.



Housing Descending
Updates on Building Permits and Housing Starts were mixed relative to expectations for July. While Building Permits exceeded forecasts by 34K, Housing Starts missed forecasts by 81K falling to the lowest annualized rate (1.446 million) since February 2021. Housing represents a large share of the US economy on both a direct and indirect basis, so its health says about the state of the overall economy, Below we have updated our chart of Housing Starts on an average 12-month basis overlaid on top of recessions. Every recession since the late 1960s has been preceded by a rollover in the average rate of Housing Starts, and usually, the rollover starts well in advance of the recession.
For the current period, Housing Starts remain right near their highest levels of the cycle, but if you look real closely, you can see that the level peaked three months ago. Looking out over history, there are plenty of other periods where Starts declined for a few months but didn’t roll over. In other words, based on what we’ve seen so far, Housing Starts have yet to show signals of an imminent recession. Based on this month’s reading and the readings from a year ago, barring a major rebound, the 12-month average is likely to keep declining in the months ahead. Another factor to keep in mind about the historical relationship between Housing Starts and recessions is that in most cases, the recession didn’t usually begin until months after the peak of Housing Starts. Click here to start a two-week trial to Bespoke Premium and receive our paid content in real-time.

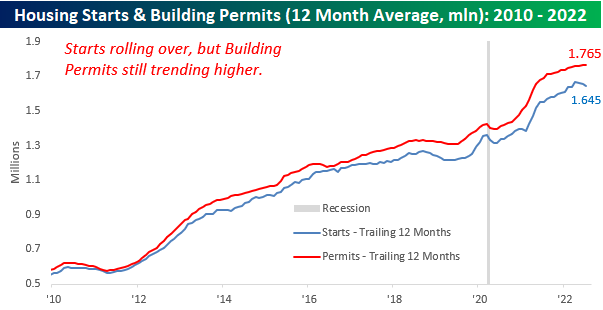
Taking a closer look at recent trends, the chart below shows the 12-month average of Building Permits and Housing Starts since the start of 2010. It’s easier here to see the decline in Starts over the last few months. Building Permits, meanwhile, have continued to trend higher.
On a single-family basis, though, both Building Permits and Housing Starts have shown signs of rolling over. Single-family Housing Starts have been moving sideways for over a year now and have just recently seen an acceleration in the rate of decline while Building Permits have been trending lower for a full year now.

Finally, the chart below compares the performance of Housing Starts over time to the performance of homebuilder stocks using the iShares US Home Construction ETF (ITB) as a proxy. While the two have tended to track each other over time, over the last couple of months, ITB has rallied while Housing Starts have been dropping. Either the market knows something about future developments in the residential housing market or investors have gotten a little offside in their positioning.
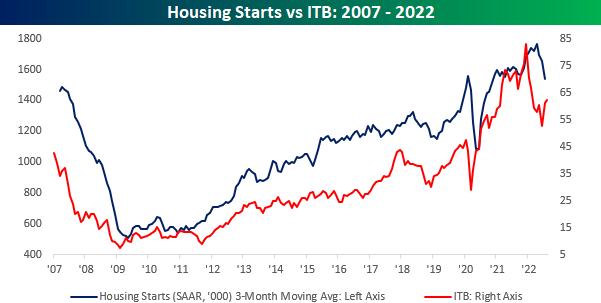
Chart of the Day: 90%+ Stocks Above 50-DMAs
Bespoke’s Morning Lineup – 8/16/22 – Checking in on the Home
See what’s driving market performance around the world in today’s Morning Lineup. Bespoke’s Morning Lineup is the best way to start your trading day. Read it now by starting a two-week trial to Bespoke Premium. CLICK HERE to learn more and start your trial.
“You should always go to other people’s funerals, or they won’t go to yours.” – George Herman Ruth

Below is a snippet of content from today’s Morning Lineup for Bespoke Premium members. Start a two-week trial to Bespoke Premium now to access the full report.
Investors generally expected a weak tone out of this morning’s updates to Building Permits and Housing Starts, and weak homebuilder sentiment provides a clue as to why. Yesterday’s update on homebuilder sentiment from the NAHB for the month of August showed that the US residential housing market is rapidly cooling off. Take the last four months, for example. In three of these four, the headline sentiment reading from the NAHB has missed expectations by at least five points. Historically, the reported reading in this index tends to come in by +/- two points relative to expectations, so misses of five or more aren’t very common. Put another way, before this May there were only ten other months since early 2003 where the headline reading missed expectations by five or more points.

Besides the fact that the last four months have been so weak relative to expectations, it has also now been nine months and running that the headline homebuilder sentiment report has been either in line with or lower than expectations. The last time Homebuilder sentiment was better than expected was back in November! The current streak without a better-than-expected reading now ranks as the second longest since at least 2003. The only streak that was longer came during the early stages of the housing crash in August 2006.

Start a two-week trial to Bespoke Premium to read today’s full Morning Lineup.
The Closer – 50-DMA Trend Shift, Empire Whiff, Positioning Fading The Rally – 8/15/22
Log-in here if you’re a member with access to the Closer.
Looking for deeper insight into markets? In tonight’s Closer sent to Bespoke Institutional clients, we start out tonight with a look at a couple of notable rejections of 50-DMAs (page 1) followed by a look at what the week Empire Fed reading implies for the broader market (page 2). We then preview this week’s upcoming Treasury auctions (page 3) before closing out with a look at some big moves in speculator positioning (pages 4 -6).

See today’s full post-market Closer and everything else Bespoke publishes by starting a 14-day trial to Bespoke Institutional today!
Daily Sector Snapshot — 8/15/22
Chart of the Day: Early Bird Not Getting The Worm
Homebuilder Sentiment Tanks… Again
As mortgage rates remain elevated relative to 2021 levels but housing supply remains thin, NAHB’s Housing Market Index fell again this month, reaching the lowest level since May of 2020. Last month, the index posted its second largest month over month decline, and following this report, the index has fallen by 18 points over the last two months, the third largest two month decline on record, falling just short of April and May of 2020. Click here to start a two-week trial to Bespoke Premium and receive our paid content in real-time.

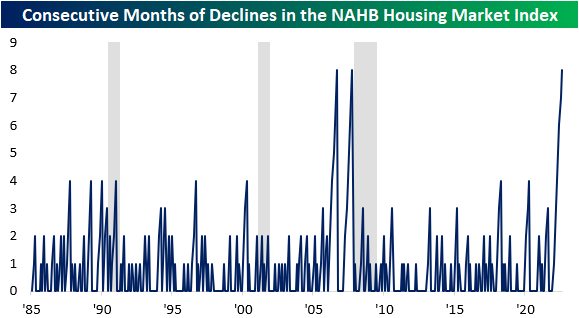
The NAHB Housing Market Index has now declined for eight consecutive months, which is tied for the longest monthly losing streak since the index’s inception in 1985. The only two other periods with an equal number of monthly declines were the eight months ending in October 2007 and before that September 2006. As most Americans remember, these periods were followed by precipitous declines in home values. Interestingly, the NY Post reported that Google searches for “sell my home fast” spiked by 2,750%.
All of the sub-indices within the report fell as well, indicating broad weakness. Apart from Future Sales and sentiment in the Western region, all of the other sub-indices experienced declines that were in the bottom 5th percentile of all periods. However, the current readings are not nearly as negative. Future sales and traffic are in the 18th and 23rd percentile, but the Northeast is still in the 63rd percentile. Although the current readings aren’t as low as the readings leading up to previous recessions, it is difficult to be positive given the current trends.

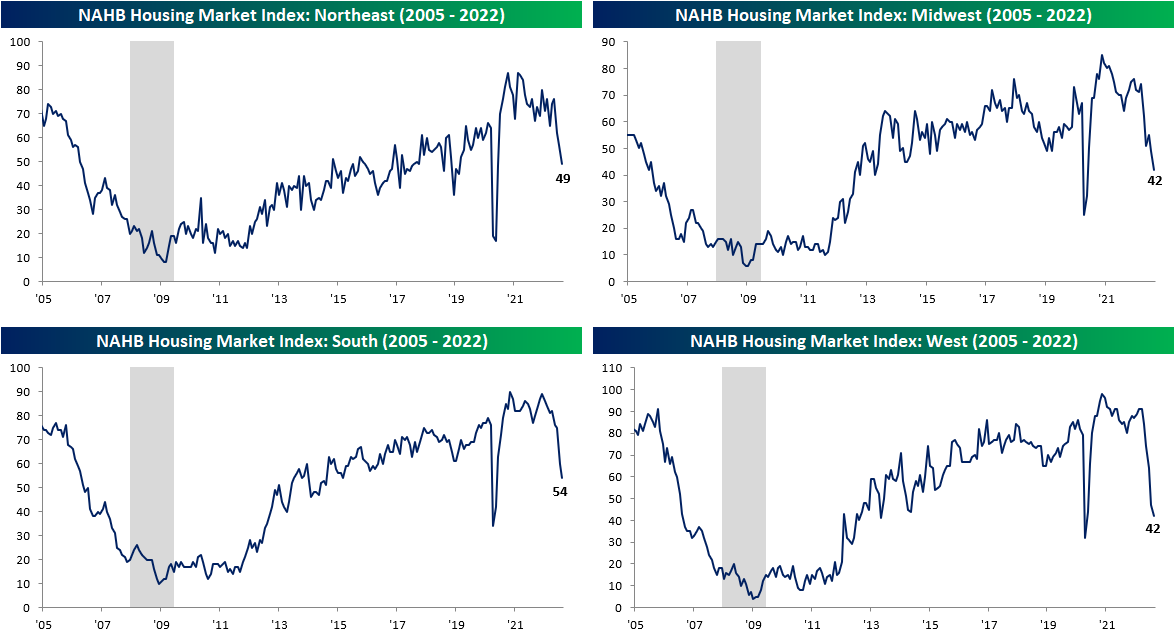
As shown above, no geographic region has been safe from the plunge in sentiment, but the Northeast has held up better than the others. Over the last eight months, the West, South, and Midwest regions have seen their largest eight-month declines in the index on record, while the decline in the Northeast is the third worst on record. Click here to start a two-week trial to Bespoke Premium and receive our paid content in real-time.
The stocks most affected by these trends – homebuilders – struggled during the sustained sell-off between the end of 2021 and mid-June, but have recovered by over 28% relative to the lows. However, the ETF is still down over 22% relative to the highs. The recovery might be due to the fact that much of the negativity has been priced in, historically low valuation multiples, and a pullback in interest rates. The chart below shows the performance of the SPDR S&P Homebuilders ETF (XBH). As you can see, XBH has broken its downtrend and has been moving consistently higher carving out what might be a new uptrend.
