
Gold to Silver Ratio Plummeting
In spite of it being considered a safe haven asset and inflation hedge, gold has had a rough year with a nearly 10% decline year to date. The yellow metal has consistently traded below its 50-DMA over the past few months while the 200-DMA is fairly flat. Over the past several days, gold has been trending sideways right near 52-week lows.

Silver has not avoided declines and like gold has largely remained below its moving averages. However, its sideways action in recent days has proven a bit more constructive. Unlike gold, silver rallied in the first half of September moving back above its 50-DMA in the process. Since then, there has not been a massive degree of follow-through, but it has managed to hold above that moving average.

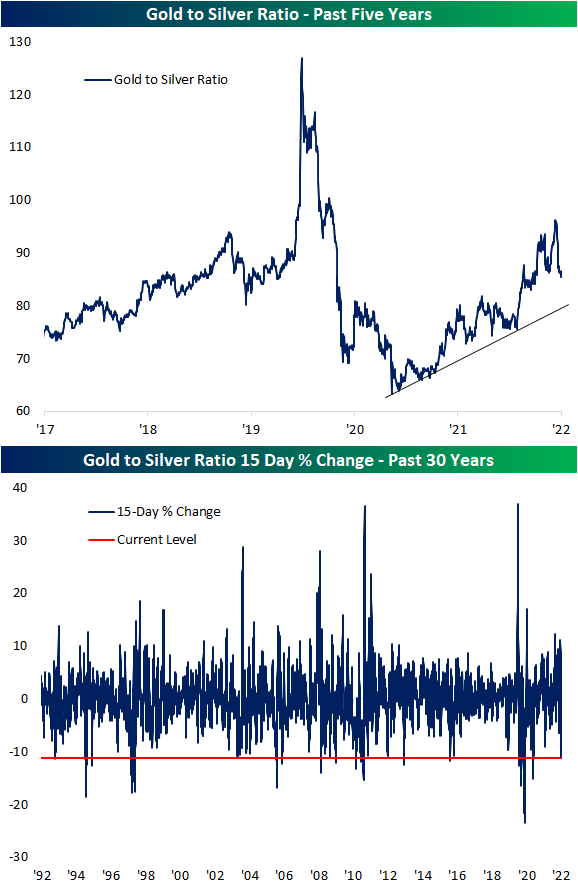
For the past year and a half, gold has generally outperformed silver as shown in the uptrend of the ratio of the two metals since early 2021. However, the underperformance of gold in recent weeks has led the ratio to pivot sharply lower. Over the past 15 days, the ratio has fallen 11%; the first double-digit decline since February 2021. Looking back through the early 1990s, there have only been a handful of other periods in which the gold-to-silver ratio has fallen by a similar degree or more in the same span of time. Outside of last year, the only other occurrences in the past decade were 2013, 2016, and 2020. Click here to learn more about Bespoke’s premium stock market research service.
Claims Staying Low
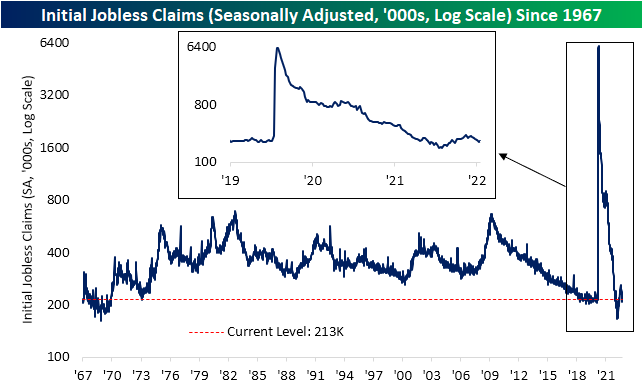
Initial jobless claims came in at 213K this week. That would have been unchanged versus the prior week, but last week’s print was revised down by 5K to 208K. That modest uptick versus the revised number marked the first increase in claims in five weeks. Albeit higher, that level is still within the range of readings from the few years prior to the pandemic.
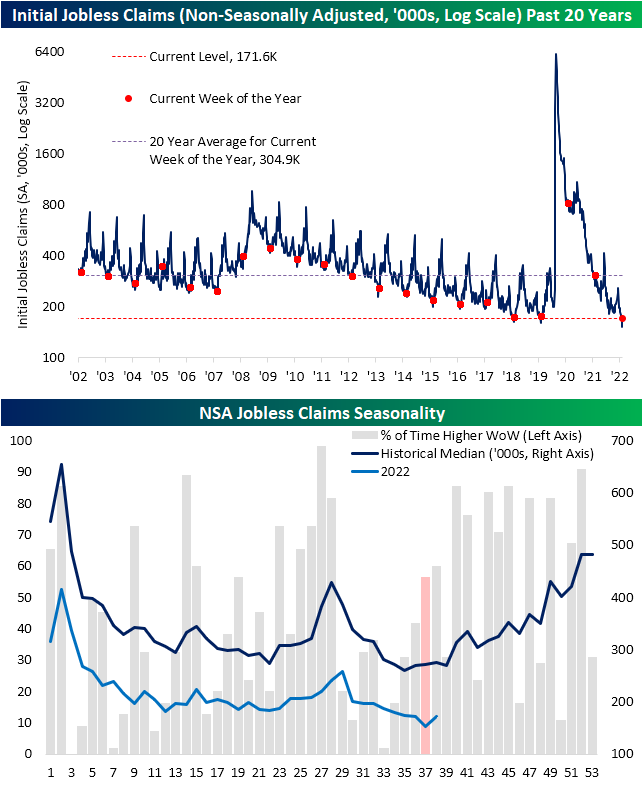
On a non-seasonally adjusted basis, claims were also higher week over week moving up to 171.6K. That increase could be expected as claims have been overdue to bottom out from a seasonal perspective as we discussed last week. That increase also does not steal from the fact that initial claims remain at historically strong levels. From here, claims are likely to continue to face seasonal headwinds through the end of the year.
As initial claims have come off of recent highs, continuing claims likewise hit the lowest level in several weeks. Seasonally adjusted continuing claims (lagged an additional week to the initial claims number) fell from 1.40 million down to 1.379 million for the lowest print since mid-July.

Earlier in the summer, we had noted how initial claims had appeared to have gotten ahead of continuing claims with the former at a comparatively higher level than the latter. That was evident by the ratio of the two surging to some of the highest levels on record. The past several weeks’ decline in initial jobless claims and the little change in continuing claims have resulted in that ratio turning lower. In fact, the latest release marked the fifth consecutive decline in that ratio. As shown in the second chart below, that now stands out as one of the longer such streaks of declines on record. Click here to learn more about Bespoke’s premium stock market research service.

Chart of the Day: Bearish Sentiment Soars…But Might Not Have Peaked
Bespoke’s Morning Lineup – 9/22/22 – Central Bank – Palooza
See what’s driving market performance around the world in today’s Morning Lineup. Bespoke’s Morning Lineup is the best way to start your trading day. Read it now by starting a two-week trial to Bespoke Premium. CLICK HERE to learn more and start your trial.
“No one knows whether this process will lead to a recession.” – Jerome Powell

Below is a snippet of content from today’s Morning Lineup for Bespoke Premium members. Start a two-week trial to Bespoke Premium now to access the full report.
Futures are modestly higher following a slew of central bank rate hikes around the world and a currency intervention from the BoJ. Jobless Claims were just released for the latest week and came in at 213K which was 4K below consensus forecasts. Continuing claims were likewise lower than forecasts coming in at a level of 1.379 million versus forecasts for a level of 1.418 million. While yesterday’s close at the lows was disheartening for the bulls, when you consider how the market has performed following positive initial reactions to the Fed this year, maybe the Fed day weakness wasn’t so bad.
Years before he became Chairman of the Federal Reserve, Jerome Powell received an undergraduate degree from Princeton, a law degree from Georgetown, was a partner at the Carlye Group, and even served as under-secretary of the Treasury for domestic finance. He’s not only extremely intelligent, but unlike many of his colleagues on the FOMC, he has real-world experience of how the private sector and financial markets work.
Given his experience, we’re sure Powell is familiar with the yield curve and how its shape impacts the economy. Specifically, when the curve inverts and short-term interest rates rise above long-term rates, it tends to slow down economic activity. While at the Carlyle Group and the private equity firm that he started after (Severn Capital Partners), he probably experienced these slowdowns firsthand and was able to make investments on good terms for his clients.
The Federal Reserve’s preferred measure of the yield curve is the spread between 3-month and 10-year US Treasuries, which still has a modestly positive slope at about 25 basis points (bps). Besides that, another widely followed point on the curve is the spread between the 2-year and 10-year US Treasuries (2s10s). As of yesterday’s close, the 2s10s curve inverted to the tune of 52 bps making it the most inverted it has been since 1982! It was nearly as inverted in April 2000, but back then the maximum point of inversion was 51 bps. Think about that for a minute. A lot of people – maybe up to half- reading this right now weren’t even alive the last time the 2s10s curve was as inverted as it is now! Looking at the chart below, since the mid-1970s, there has never been a period when the 2s10s yield curve was as inverted as it is now that a recession wasn’t just over the horizon.

Getting back to Chair Powell, at one point in his press conference yesterday, he responded to one question with the answer that “No one knows whether this process will lead to a recession.” Let’s get this straight. The yield curve is extremely inverted, GDP growth in the first two quarters of this year has already been negative, and forecasts for growth in Q3 have been steadily declining as we close out the month. All this is before the recent unprecedented round of 75 bps rate hikes have had the opportunity to filter through the economy, and yet the Fed Chair is unsure of whether the US economy is either already in or on pace for a recession. Now we know that it’s not a good look for a Fed Chair to forecast a recession as the base case scenario, but does he really believe what he’s saying?
Our Morning Lineup keeps readers on top of earnings data, economic news, global headlines, and market internals. We’re biased (of course!), but we think it’s the best and most helpful pre-market report in existence!
Start a two-week trial to Bespoke Premium to read today’s full Morning Lineup.
The Closer – Stocks Finally Drop On Fed Day – 9/21/22
Log-in here if you’re a member with access to the Closer.
Looking for deeper insight into markets? In tonight’s Closer sent to Bespoke Institutional clients, we start out tonight with a look at the FOMC’s updated of the Summary of Economic Projects (page 1) as well as the market reaction to the Fed including the near record streak that ended (page 2). Next, we provide an review of the latest existing home sales data (pages 3 and 4) followed by the latest EIA data (page 5).

See today’s full post-market Closer and everything else Bespoke publishes by starting a 14-day trial to Bespoke Institutional today!
Daily Sector Snapshot — 9/21/22
Bespoke Baskets Update — September 2022
Chart of the Day: Decile Analysis Since the Mid-August High
Fixed Income Weekly: 9/21/22
Searching for ways to better understand the fixed income space or looking for actionable ideas in this asset class? Bespoke’s Fixed Income Weekly provides an update on rates and credit every Wednesday. We start off with a fresh piece of analysis driven by what’s in the headlines or driving the market in a given week. We then provide charts of how US Treasury futures and rates are trading, before moving on to a summary of recent fixed income ETF performance, short-term interest rates including money market funds, and a trade idea. We summarize changes and recent developments for a variety of yield curves (UST, bund, Eurodollar, US breakeven inflation and Bespoke’s Global Yield Curve) before finishing with a review of recent UST yield curve changes, spread changes for major credit products and international bonds, and 1 year return profiles for a cross section of the fixed income world.
In this week’s report we highlight the extreme cheapness of the 20y sector of the yield curve.

Our Fixed Income Weekly helps investors stay on top of fixed income markets and gain new perspective on the developments in interest rates. You can sign up for a Bespoke research trial below to see this week’s report and everything else Bespoke publishes free for the next two weeks!
Click here and start a 14-day free trial to Bespoke Institutional to see our newest Fixed Income Weekly now!