
Chart of the Day: Record Wealth Destruction Continues
Optimism Nowhere to Be Found
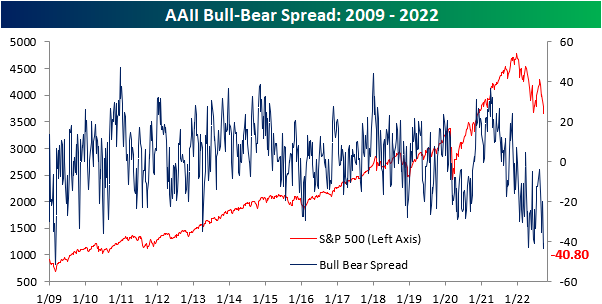
Although the S&P 500 hit 52-week lows for the first time since June this week, bulls actually stepped back up to the plate (in a very small way). Bullish sentiment, according to the AAII sentiment survey, rose back up to 20% after a low of 17.7% last week. Even with that modest increase, bullish sentiment remains historically muted at 17.7 percentage points below the historical norm.

Bearish sentiment likewise remains elevated and hardly improved. The latest reading dropped marginally from 60.9% to 60.8% marking the first time on record that there have been back-to-back readings of 60% or more as we noted in an earlier tweet. The only other times bearish sentiment came in above 60% were in March 2009, October 2008, and August and October 1990.

Given the near record high in bearish sentiment coupled with the slight increase in bullish sentiment, the bull-bear spread improved rising from -43.2 to -40.8. Again, in spite of that improvement, the latest reading shows that bears continue to heavily outweigh bulls to a historic degree.
Given both bulls and bears are at extremes, recent moves have borrowed heavily from neutral sentiment. That reading has fallen sharply over the past three weeks and is back below 20% for the lowest reading since April 2020. The 9.5 percentage point decline over the past three weeks has been the largest drop in such a span since May pointing to investors being increasingly polarized.

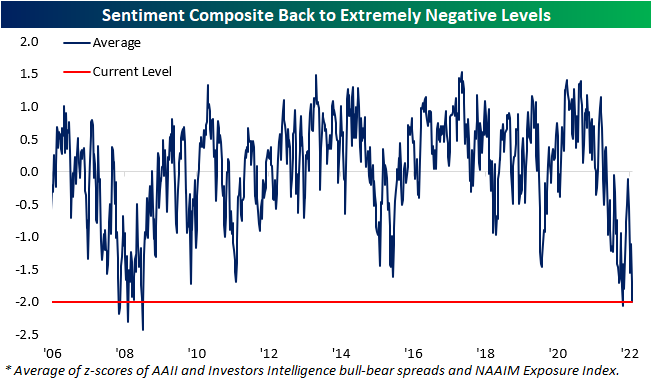
The AAII survey may have moved slightly less bearish this week on net, but other sentiment surveys saw the opposite results. The Investors Intelligence survey saw bulls hit the lowest level since 2016, and the NAAIM exposure index showed the least long exposure to equities since March 2020. Standardizing and then combining each of these surveys shows that the average reading is now two full standard deviations below the historical norm. That is slightly better than the June low with the only other period with as depressed a level of sentiment being the financial crisis years. Click here to learn more about Bespoke’s premium stock market research service.
Claims Go Lower and Lower
Adding ammunition to the hawkish tone out of the Fed, this week’s initial jobless claims number showed yet another decline to already impressively low levels. Not only was last week’s reading revised down by 4K to 213K, but this week’s reading fell back below 200K. Now at 193K, claims are back to where they were in April after having fallen for six of the last seven weeks. With a drop back below 200K, claims have fallen back below the range from the couple of years prior to the pandemic. Outside of lows earlier this year, that would be some of the best levels for claims since 1969.

Before seasonal adjustment, it is an even equally impressive low. For the comparable week of the year, this most recent reading of 156.1K was the lowest since 1969 and was only slightly above the seasonal low from a couple of weeks ago. While it does not steal from how strong claims have been, we would note that the current week of the year does have some seasonal tailwinds with a decline roughly 70% of the time.

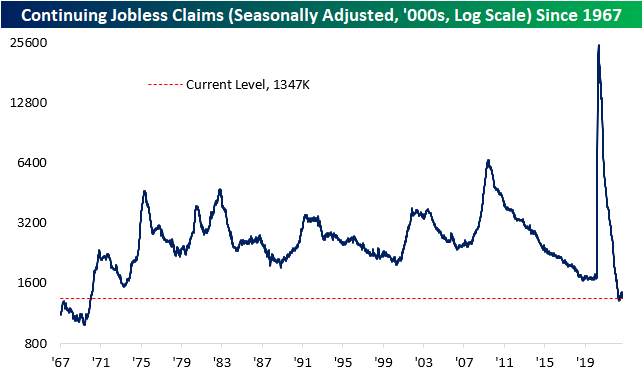
Continuing claims are lagged an additional week to initial claims making the most recent print through the week of September 16th. Claims fell for the sixth consecutive week to reach 1.347 million, the lowest level since the first week of July. Click here to learn more about Bespoke’s premium stock market research service.
The Bespoke 50 Growth Stocks — 9/29/22
The “Bespoke 50” is a basket of noteworthy growth stocks in the Russell 3,000. To make the list, a stock must have strong earnings growth prospects along with an attractive price chart based on Bespoke’s analysis. The Bespoke 50 is updated weekly on Thursday unless otherwise noted. There were 19 changes to the list this week.
The Bespoke 50 is available with a Bespoke Premium subscription or a Bespoke Institutional subscription. You can learn more about our subscription offerings at our Membership Options page, or simply start a two-week trial at our sign-up page.

The Bespoke 50 performance chart shown does not represent actual investment results. The Bespoke 50 is updated weekly on Thursday. Performance is based on equally weighting each of the 50 stocks (2% each) and is calculated using each stock’s opening price as of Friday morning each week. Entry prices and exit prices used for stocks that are added or removed from the Bespoke 50 are based on Friday’s opening price. Any potential commissions, brokerage fees, or dividends are not included in the Bespoke 50 performance calculation, but the performance shown is net of a hypothetical annual advisory fee of 0.85%. Performance tracking for the Bespoke 50 and the Russell 3,000 total return index begins on March 5th, 2012 when the Bespoke 50 was first published. Past performance is not a guarantee of future results. The Bespoke 50 is meant to be an idea generator for investors and not a recommendation to buy or sell any specific securities. It is not personalized advice because it in no way takes into account an investor’s individual needs. As always, investors should conduct their own research when buying or selling individual securities. Click here to read our full disclosure on hypothetical performance tracking. Bespoke representatives or wealth management clients may have positions in securities discussed or mentioned in its published content.
Bespoke’s Morning Lineup – 9/29/22 – Fundamentals Don’t Matter
See what’s driving market performance around the world in today’s Morning Lineup. Bespoke’s Morning Lineup is the best way to start your trading day. Read it now by starting a two-week trial to Bespoke Premium. CLICK HERE to learn more and start your trial.
“When you see only problems, you’re not seeing clearly.” – Phil Knight

Below is a snippet of content from today’s Morning Lineup for Bespoke Premium members. Start a two-week trial to Bespoke Premium now to access the full report.
The rally was fun while it lasted. Futures are sharply lower this morning and poised to give up over half of Wednesday’s gains at the opening bell. An interview with Cleveland Fed President Loretta Mester where she reiterated her hawkish stance hasn’t helped sentiment nor has the fact that initial jobless claims dropped below 200K and continuing claims were also lower than expected. As if that wasn’t bad enough, the GDP Price Index and Core PCE were both revised higher. If there’s any silver lining to those upwardly revised inflation readings, it’s that it will make it more likely that these readings for Q3 show some deceleration.
These days, either all stocks rise, or they all fall. There is little in-between. It’s like flipping a switch. In yesterday’s rally, the S&P 500’s net A/D reading was +477 which was the strongest single-day breadth reading since late July and before that April 2020. Yesterday’s strong breadth reading was the 7th this month and the 31st ‘all or nothing’ day (single day breadth reading either above +400 or below -400) for the S&P 500 this year, bringing the full-year pace to 42. That would be just one shy of the 2020 total of 43 and the sixth highest single-year total since 1990. Besides 2020, the only years with a higher number of all or nothing days were during and coming out of the Financial Crisis from 2008 through 2011.
In a normal functioning market, fundamentals play a large role in the direction of individual stock prices. There are certain times, like now though, where the seas get rough, and Captain Macro takes the helm relegating fundamentals to steerage. If you’ve ever been seasick on a boat, though, the last place you want to be is down below.

Our Morning Lineup keeps readers on top of earnings data, economic news, global headlines, and market internals. We’re biased (of course!), but we think it’s the best and most helpful pre-market report in existence!
Start a two-week trial to Bespoke Premium to read today’s full Morning Lineup.
The Closer – Fixed Income Surge, Prices PCA, CFO Confidence, 7y Auction, EIA – 9/28/22
Log-in here if you’re a member with access to the Closer.
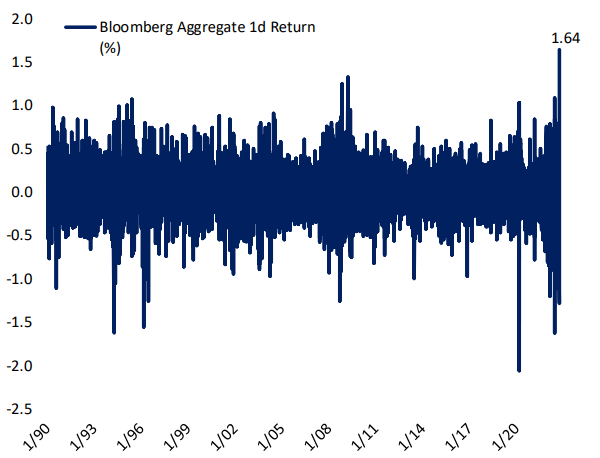
Looking for deeper insight into markets? In tonight’s Closer sent to Bespoke Institutional clients, we start out looking at the historic moves across fixed income markets (page 1) followed by a principal component analysis of eight different assets (page 2). Turning to macro data, we highlight the trade deficit surge (page 3), the latest CFO survey (page 4), and EIA data (page 5). We finish with a rundown of the 7 year note auction (page 6).
See today’s full post-market Closer and everything else Bespoke publishes by starting a 14-day trial to Bespoke Institutional today!
Daily Sector Snapshot — 9/28/22
Global Equities Reaching New 52-Week Lows
Being the last Wednesday of the month, today we published our most recent update of our Global Macro Dashboard which provides overviews of 22 major global economies. In the matrix below, we show the performance of ETFs that track the stock markets of these same countries.
Globally, stocks have gotten crushed in the past year with an average decline of 30% from 52-week highs; we would also note that developed markets have faired slightly worse than emerging markets. In fact, in the past few days, nearly every one of these countries has made a new 52-week low. There are a couple of holdouts though: Brazil (EWZ) and India (INDA). Compared to the S&P 500 low on June 16th (which was the 52-week low prior to this week and the level the index is currently hovering near) INDA and EWZ are again the only two countries with a solid gain by any stretch. As for one other distinguishing characteristic, these two countries are the only ones to not be in or be in the process of entering—as is the case with Mexico (EWW)—oversold territory.

While everything is well below current 52-week highs, there are only four country ETFs that are also above pre-COVID highs (the 52-week high as of the S&P 500 high on 2/19/20). India (INDA) is, of course, the most elevated above those levels at 13.5% followed by the US. Taiwan (EWT) and Canada (EWC) are within more tangible reach of pre-COVID highs given their recent breach of spring support has been far more material than SPY. Click here to learn more about Bespoke’s premium stock market research service.
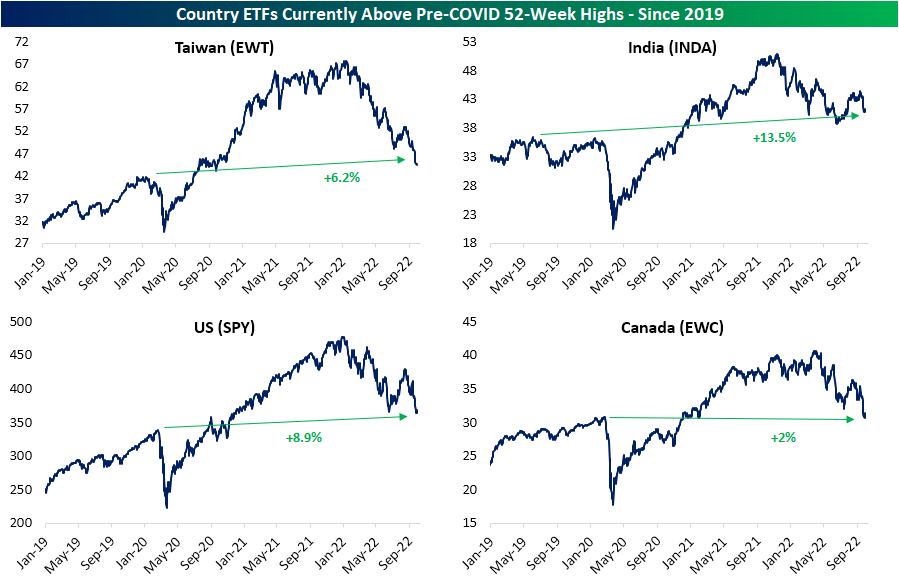
Chart of the Day – Seasonality: The Heart of the Year
Fixed Income Weekly: 9/28/22
Searching for ways to better understand the fixed income space or looking for actionable ideas in this asset class? Bespoke’s Fixed Income Weekly provides an update on rates and credit every Wednesday. We start off with a fresh piece of analysis driven by what’s in the headlines or driving the market in a given week. We then provide charts of how US Treasury futures and rates are trading, before moving on to a summary of recent fixed income ETF performance, short-term interest rates including money market funds, and a trade idea. We summarize changes and recent developments for a variety of yield curves (UST, bund, Eurodollar, US breakeven inflation and Bespoke’s Global Yield Curve) before finishing with a review of recent UST yield curve changes, spread changes for major credit products and international bonds, and 1 year return profiles for a cross section of the fixed income world.
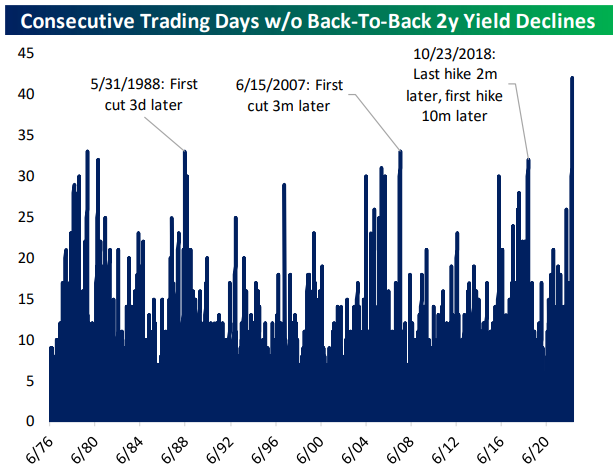
In this week’s report we argue bond selling has likely reached an at least temporary extreme ahead of a counter-trend move.
Our Fixed Income Weekly helps investors stay on top of fixed income markets and gain new perspective on the developments in interest rates. You can sign up for a Bespoke research trial below to see this week’s report and everything else Bespoke publishes free for the next two weeks!
Click here and start a 14-day free trial to Bespoke Institutional to see our newest Fixed Income Weekly now!