
Daily Sector Snapshot — 11/30/22
Fixed Income Weekly: 11/30/22
Searching for ways to better understand the fixed income space or looking for actionable ideas in this asset class? Bespoke’s Fixed Income Weekly provides an update on rates and credit every Wednesday. We start off with a fresh piece of analysis driven by what’s in the headlines or driving the market in a given week. We then provide charts of how US Treasury futures and rates are trading, before moving on to a summary of recent fixed income ETF performance, short-term interest rates including money market funds, and a trade idea. We summarize changes and recent developments for a variety of yield curves (UST, bund, Eurodollar, US breakeven inflation and Bespoke’s Global Yield Curve) before finishing with a review of recent UST yield curve changes, spread changes for major credit products and international bonds, and 1 year return profiles for a cross section of the fixed income world.
In this week’s report, we review the income generation of the rental housing market.

Our Fixed Income Weekly helps investors stay on top of fixed-income markets and gain new perspectives on the developments in interest rates. You can sign up for a Bespoke research trial below to see this week’s report and everything else Bespoke publishes free for the next two weeks!
Click here and start a 14-day free trial to Bespoke Institutional to see our newest Fixed Income Weekly now!
Purchases Rebound and Refinances Plunge
Prospective home buyers have finally gotten some relief at least in terms of mortgage rates. The national average for a 30-year fixed rate mortgage via Bankrate.com’s data is down to 6.78% from a high of 7.35% on November 3rd. While that remains at levels we haven’t seen since the early 2000s, the roughly half of one percentage point decline in the past three weeks is also remarkable. As shown in the second chart below, on Monday, the national average had fallen 0.53 percentage points in a three-week span. The only other time in which there was as large of a drop in that period of time was in September 2008.

Given rates for 30-year mortgages are at the highest level in a couple of decades, there has been little incentive for most homeowners to refinance resulting in refinance applications continuing to evaporate. Applications fell 12.87% week over week bringing the index down to the lowest level since June 2000.

Purchases applications have been more largely impacted by the recent reversal in rates. The Mortgage Bankers Association’s purchase index has now risen four weeks in a row (the longest streak of consecutive increases since last November). The 12.77% jump in purchase applications in that time has been the largest four-week jump since a 14.61% increase in November of last year. Of course, that only puts a minor dent in the absolute collapse in mortgage activity over the past year.
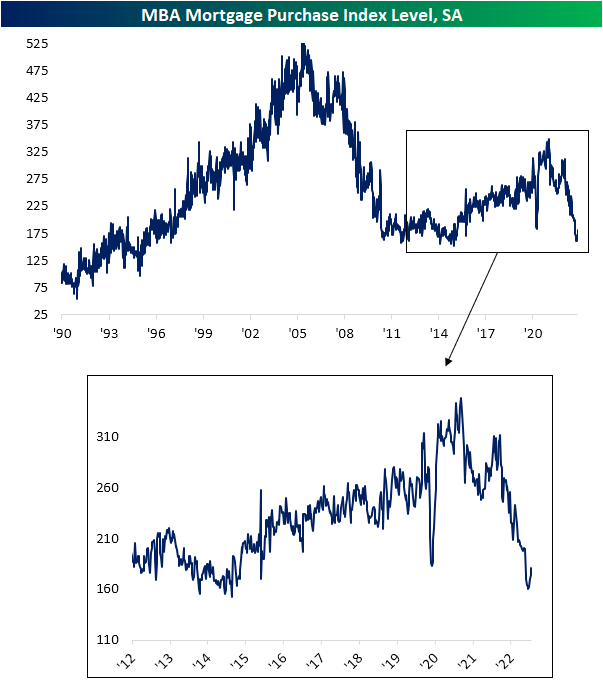
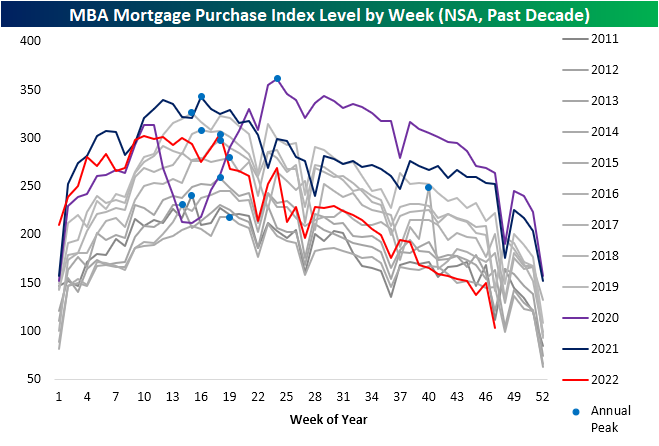
Showing purchase applications on a non-seasonally adjusted basis better illustrates housing’s fall from grace this year. Whereas applications started the year around some of the highest levels of the past decade for that time of year, this week they have hit the lowest level for the comparable week of the year of the past decade. That’s what happens when the FOMC embarks on one of the most aggressive tightening cycles in history! Of course, the Thanksgiving holiday tends to negatively impact implications, and looking at 2014 (when the Thanksgiving drop occurred a week later than this year) applications were slightly lower than this year.
Shown another way, below we show the percent change in applications from each year’s respective annual peak out through 29 weeks later. This year has seen applications fall 66%. That was a similar decline to 2001, and the only year with a larger decline was in 2007. Click here to learn more about Bespoke’s premium stock market research service.

Chart of the Day: December 2022 Seasonality
Bespoke’s Morning Lineup – 11/30/22 – One Month to Go
See what’s driving market performance around the world in today’s Morning Lineup. Bespoke’s Morning Lineup is the best way to start your trading day. Read it now by starting a two-week trial to Bespoke Premium. CLICK HERE to learn more and start your trial.
“There is nothing government can give you that it hasn’t taken from you in the first place.” – Winston Churchill

Below is a snippet of content from today’s Morning Lineup for Bespoke Premium members. Start a two-week trial to Bespoke Premium now to access the full report.
European stocks are trading higher this morning as inflation in the region came in at a weaker-than-expected 10% y/y. 10%! If that doesn’t sum things up for 2022, we don’t know what does. Economists were forecasting the headline number to come in at 10.4%, but with the m/m reading actually falling 0.1% in November, markets are rallying.
Futures here in the US are also higher on the positive inflation data out of Europe, but there’s still a lot of data on the calendar to contend with starting off with the November ADP Employment report which came in at a weaker-than-expected 127K (estimate 198K). The second read of Q3 GDP, Core PCE, and Personal Consumption will all be released at 8:30, and then at 10 AM, we’ll get the October report on Pending Home Sales. The 8:30 data was just released and came in mixed relative to expectations with GDP revised higher while PCE came in higher than expected. Besides all the economic data, Powell’s speech at the Brookings Institution at 1:30 is likely to be the biggest market mover of the day.
While US stocks are set to end the month of November with modest gains, stocks in Hong Kong have been on a tear as the benchmark Hang Seng index rallied an astonishing 26.62% for its largest monthly gain since October 1998 and just its ninth monthly gain of 25% or more since 1970. As great as this month’s rally in Hong Kong stocks sounds, we would note that since the end of August, the index is still down nearly 7%, and YTD it’s down over 20%. Again, these performance numbers are after you factor in November’s rally. The S&P 500 may only be up 2% this month, but since the end of August, it is actually up fractionally, and YTD it’s not down as much as the Hang Seng.

You’ve likely heard the phrase that big market moves tend to occur during bear markets but in the case of the Hang Seng and monster moves, that hasn’t entirely been the case. The chart below shows Hong Kong’s benchmark index going back to 1970 with red dots indicating every time the index moved 25% or more in a month. Looking at the chart, more of these moves actually tended to occur in the later stages of bull market runs or early on in a rally. What is unique about November’s move is that it is only the second time that the index rallied 25%+ but was still down over the trailing three months. The only other time that occurred was in January 1975 when the Hang Seng rallied more than 28% but was still down nearly 2% over the last three months. It’s a sample size of one, but bulls wouldn’t mind if history repeated itself.

Our Morning Lineup keeps readers on top of earnings data, economic news, global headlines, and market internals. We’re biased (of course!), but we think it’s the best and most helpful pre-market report in existence!
Start a two-week trial to Bespoke Premium to read today’s full Morning Lineup.
The Closer – Yields Stable, Home Prices Lower, Housing Sentiment Flags – 11/29/22
Log-in here if you’re a member with access to the Closer.
Looking for deeper insight into markets? In tonight’s Closer sent to Bespoke Institutional clients, in tonight’s note, we begin with some commentary on recent 2 year yield, dollar, credit, and VIX action (page 1) followed by an update on the latest home price data (page 2). We finish with some commentary on the latest sentiment data from a range of indicators including our latest Consumer Pulse Survey (pages 3 and 4).

See today’s full post-market Closer and everything else Bespoke publishes by starting a 14-day trial to Bespoke Institutional today!
Daily Sector Snapshot — 11/29/22
Chart of the Day – 2s10s Inversion Streak Reaches Triple Digits
Home Prices Down But Still Sky-High
September numbers for home prices across the country were released by S&P CoreLogic Case Shiller this morning. Below is a look at how much home prices are up since February 2020 just before COVID hit. The National index is up 41%, while Tampa, Phoenix, and Miami are all up 63% or more. At the lower end of the gains are Washington DC, Minneapolis, San Francisco, and Chicago with price increases between 27% and 31%.

Prices are off of their post-COVID highs, however, and remember that this data is only through September. We’ve likely seen prices fall even further over the last two months. As shown below, the 10-city and 20-city composite indices are down 3.9%, while the National index is down 2.6%. San Francisco and Seattle have seen the biggest drops in home prices so far with declines of more than 11%. San Diego is down 7.9%, Los Angeles is down 6.0%, and Denver is down 5.7%. Cleveland, Chicago, Atlanta, Miami, New York, and Tampa have thus far seen the smallest drops from their highs with declines ranging from -0.8% to -1.3%.

Below is a table showing the data from the two charts above along with a look at month-over-month and year-over-year percentage change. So far at least, cities in the western US have seen the biggest declines from their post-COVID highs, while areas in the southeastern US and south Florida that saw some of the biggest post-COVID gains have only seen minimal declines.

Below are long-term charts of the twenty individual city home price indices along with the National and 10-city and 20-city Composite indices. These charts really show how much home prices rose over the last couple of years and how small the declines have been so far. The recent drop has been like going from the 100th floor down to the 99th floor of an NYC skyscraper. Click here to learn more about Bespoke’s premium stock market research service.


