
Fixed Income Weekly: 12/7/22
Searching for ways to better understand the fixed income space or looking for actionable ideas in this asset class? Bespoke’s Fixed Income Weekly provides an update on rates and credit every Wednesday. We start off with a fresh piece of analysis driven by what’s in the headlines or driving the market in a given week. We then provide charts of how US Treasury futures and rates are trading, before moving on to a summary of recent fixed income ETF performance, short-term interest rates including money market funds, and a trade idea. We summarize changes and recent developments for a variety of yield curves (UST, bund, Eurodollar, US breakeven inflation and Bespoke’s Global Yield Curve) before finishing with a review of recent UST yield curve changes, spread changes for major credit products and international bonds, and 1 year return profiles for a cross section of the fixed income world.
In this week’s report, we discuss the evolution of fixed income flows this year.
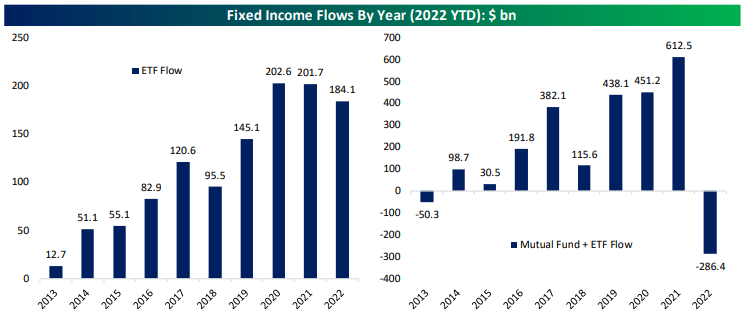
Our Fixed Income Weekly helps investors stay on top of fixed-income markets and gain new perspectives on the developments in interest rates. You can sign up for a Bespoke research trial below to see this week’s report and everything else Bespoke publishes free for the next two weeks!
Click here and start a 14-day free trial to Bespoke Institutional to see our newest Fixed Income Weekly now!
S&P 500 (SPY) December Drop
The S&P 500 (SPY) has struggled to pick a direction so far this morning but at least as of this writing, it is on pace to finish lower yet again. From a technical perspective, the index is at a cross roads having formed a wedge in the past couple of months. During the recent rally, SPY did manage to move back above its 200-DMA, but it couldn’t quite get above the past year’s downtrend line. After the streak of declines in the past week, it has returned to the bottom of the rough uptrend line that has been in place off the October lows.

Again price action has been choppy so far today, and while further declines could result in a break down, it would also mark an impressive, but not exactly unheard of, streak of declines. As shown below, it would be the fifth daily decline in a row. From a historical perspective, that is not particularly rare with 65 other streaks of 5 days or more since SPY began trading. As recently as October and September, there were two streaks that even extended to 6 days long.
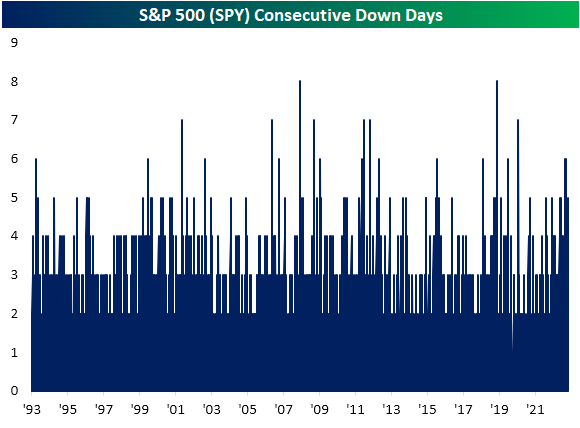
What is more rare is for these streaks to start at the beginning of a new month. In fact, this month’s 3.5% drop to start December is on pace to be the 20th worst start of a month for the S&P 500 ETF (SPY) since inception, and there have only been two other times in which all of the first five trading days of a month have seen declines: February 2002 and June 2011. As shown below, those streaks of declines actually came in what were the middle of periods of consolidation while the following few months went on to experience further downside. As for the actual size of the declines, both of those previous instances saw larger drops (roughly around 4.5%) than the 3.5% decline currently.


Bespoke’s Morning Lineup – 12/7/22 – Down-cember
See what’s driving market performance around the world in today’s Morning Lineup. Bespoke’s Morning Lineup is the best way to start your trading day. Read it now by starting a two-week trial to Bespoke Premium. CLICK HERE to learn more and start your trial.
“Theory is splendid but until put into practice, it is valueless.” – James Cash Penney

Below is a snippet of content from today’s Morning Lineup for Bespoke Premium members. Start a two-week trial to Bespoke Premium now to access the full report.
December just keeps getting lousier and lousier as futures are negative, putting the S&P 500 on pace for five straight losses to kick off what has historically been one of the more positive months of the year. The culprit for this morning’s weakness is negative trade data out of China, and the action in oil over the last couple of days has been signaling that weakness. The just released reports on Nonfarm Productivity and Unit Labor Costs came in better than expected providing a boost to futures but at this point, not enough to push them into positive territory.
It hasn’t been a healthy start to the month of December for the market, but the Health Care sector has held up better than a lot of others with its decline of less than 1.3%. The sector has had a strong run from its October lows, and technicians are salivating over the impending ‘golden cross’ for the sector. A golden cross occurs when a security’s short-term moving average crosses above a longer-term one as both are rising, and it’s considered a positive technical pattern. In the case of the Health Care sector, we’re looking at the 50 and 200-day moving averages and barring any major moves, that crossover will occur tomorrow.

With a lot of technical patterns, the theoretical doesn’t always translate to reality. The table below lists the thirteen prior golden crosses for the Health Care sector since the start of 1990, and for each one, we list the sector’s performance following that occurrence. As shown at the bottom of the table, while median returns over the following week and month were better than the average for all periods since 1990, median returns three and six months later were actually below the long-term average for all periods. One year later, the Health Care sector was positive 12 out of 13 times for a median gain of 9.2%, and while the consistency of positive returns was better than average, the median return of 9.2% was basically right in line with the historical average. Historically speaking, golden crosses for the Health Care sector haven’t been bad, but they haven’t necessarily been followed by better-than-average returns either.

Our Morning Lineup keeps readers on top of earnings data, economic news, global headlines, and market internals. We’re biased (of course!), but we think it’s the best and most helpful pre-market report in existence!
Start a two-week trial to Bespoke Premium to read today’s full Morning Lineup.
Bonds Catch a Bid as Stocks Sink
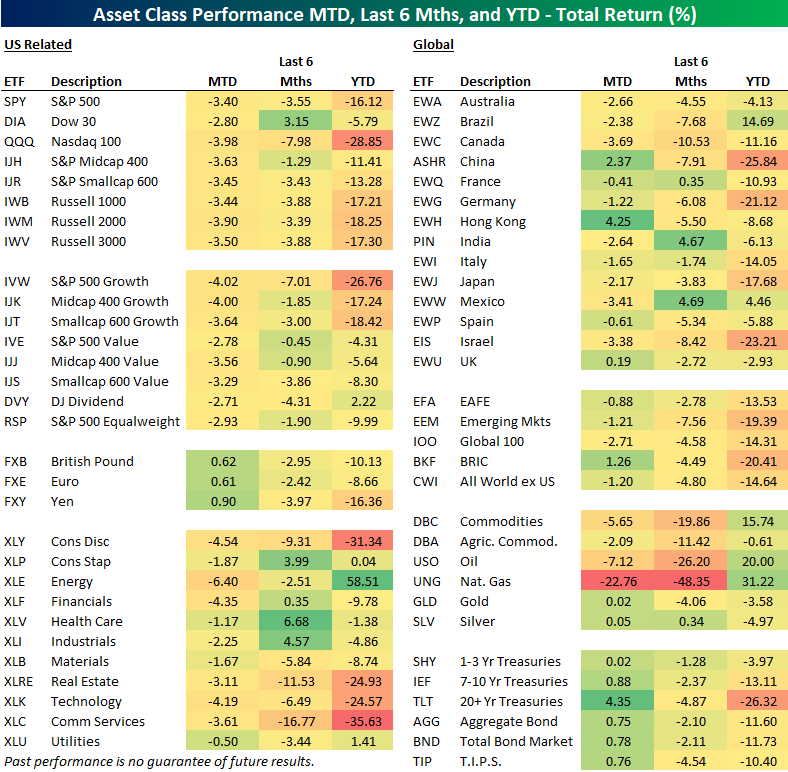
US equity markets have gotten off to a very weak start to December with four consecutive declines to start the month (and futures on Wednesday pointing to a fifth straight day). As shown below, SPY and most other major US index ETFs are already down more than 3% MTD, with growth underperforming value by a bit. Energy (XLE) is down most of the US sector ETFs followed by Consumer Discretionary (XLY) and Financials (XLF). Utilities (XLU) is down the least so far in December at just -0.50%.
International equity markets have held up a little better than the US. The All-World ex-US ETF (CWI) and the Emerging Markets ETF (EEM) are both down just 1.2% MTD, and the All-World ex-US ETF is now outperforming SPY on a YTD basis because of the recent divergence.
For most of the year heading into December, we saw the bond market fall in tandem with stocks, but recently as stocks have dropped, bonds have caught a bid. As shown in the bottom right corner of our ETF matrix below, Treasury ETFs of all durations are up on the month, with the 20+ Year Treasury (TLT) up the most at 4.35%.
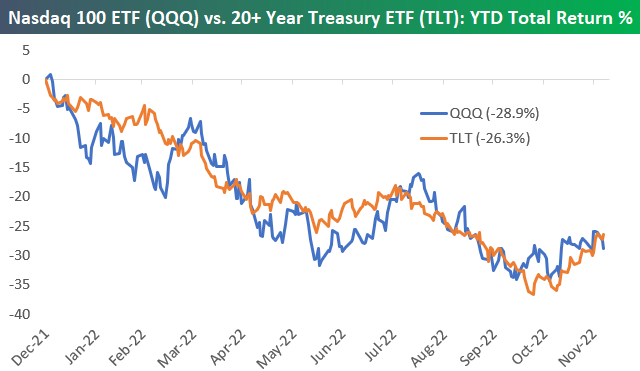
The chart below of the year-to-date percentage change (total return) of the Nasdaq 100 (QQQ) and the 20+ Year Treasury ETF (TLT) is a great way to highlight how closely stocks and bonds have tracked each other this year. So far this month, QQQ is down 3.98%, while TLT is up 4.35%, but this performance divergence over the last four days hardly shows up yet on the chart. Click here to learn more about Bespoke’s premium stock market research service.
The Closer – Stocks Slice Led By Energy – 12/6/22
Log-in here if you’re a member with access to the Closer.
Looking for deeper insight into markets? In tonight’s Closer sent to Bespoke Institutional clients, we begin tonight with a look at the S&P 500’s continued decline, honing in on the drop in Energy stocks (page 1). We then review the charts and term structures of crude oil (page 2) and gasoline and heating oil (page 3 and 4). Turning to economic data, we dive into the latest trade balance figures (page 5). We finish with an update of the latest supply chain data from the New York Fed and Logistics Managers’ Index (pages 6 – 8).

See today’s full post-market Closer and everything else Bespoke publishes by starting a 14-day trial to Bespoke Institutional today!
Daily Sector Snapshot — 12/6/22
Bespoke Stock Scores — 12/6/22
Chart of the Day: Down Day Analysis
Bespoke’s Morning Lineup – 12/6/22 – Low-Energy Energy
See what’s driving market performance around the world in today’s Morning Lineup. Bespoke’s Morning Lineup is the best way to start your trading day. Read it now by starting a two-week trial to Bespoke Premium. CLICK HERE to learn more and start your trial.
“Sometimes, you can learn more from criticism than you can from flattery.” – Doug McMillon
Below is a snippet of content from today’s Morning Lineup for Bespoke Premium members. Start a two-week trial to Bespoke Premium now to access the full report.
It’s been a quiet morning for both earnings and economic news, and futures are doing little in response after yesterday’s drubbing. JP Morgan Chase (JPM) CEO Jamie Dimon was on CNBC earlier and said he expects to see a recession in 2023. That echoes comments from UAL CEO Scott Kirby who also expects to see a mild Fed-induced recession while noting that business travel has plateaued. Other CEOs appearing on CNBC this morning didn’t go as far as to use the r-word, but Union Pacific (UNP) CEO Lance Fritz sees the economy and consumer slowing driven by weakness in housing, and Walmart CEO Doug McMillon said he sees the low-end consumer being pressured as the percentage of consumers making more than $100K per year visiting stores increases.
Yesterday, we were talking about the mixed signals coming from the equity market. Today, it’s the Energy sector’s turn. Energy-related commodities were all the rage earlier this year when Russia invaded Ukraine, setting off the potential for major supply disruptions in both the global natural gas and oil markets. At one point earlier this year, WTI was up over 64% YTD and natural gas was up 160%. That helped to push the Energy sector to a gain of over 70% on the year while just about every other area of the market was down YTD, and in many cases, down big.
Since the initial hysteria in Energy markets earlier this year, energy-related commodities have come crashing back down to earth. Over the last six months, WTI is down 35%, and natural gas is down 40%. With declines of that magnitude, you would expect to see Energy stocks under heavy pressure, but during that same span, the Energy sector is down less than 1.5% and still up 58% YTD. To be sure, even after the recent big declines in energy commodities, they’re still positive YTD, although both natural gas (51%) and crude oil (3%) have trailed the gains in Energy equities.
One explanation given for the outperformance of Energy stocks versus the commodities has been the Biden Administration’s release of oil from the Strategic Petroleum Reserve (SPR) which has acted as an artificial weight on prices. That’s certainly a valid argument, but natural gas has not had to contend with increased supply from an SPR and yet it too is down just as much as crude oil in the last six months. Just when you think you have the market figured out, it throws you a curveball.

Our Morning Lineup keeps readers on top of earnings data, economic news, global headlines, and market internals. We’re biased (of course!), but we think it’s the best and most helpful pre-market report in existence!
Start a two-week trial to Bespoke Premium to read today’s full Morning Lineup.
The Closer – More Big Swings in Breadth – 12/5/22
Log-in here if you’re a member with access to the Closer.
Looking for deeper insight into markets? In tonight’s Closer sent to Bespoke Institutional clients, we start out tonight with a look at the huge swings in breadth over the past year (page 1) followed by a look at a handful of technical indicators (page 2). We then take a look at the latest PMIs (page 3) and factory sales (page 4). Next, we review the latest mortgage delinquency data (page 5) before wrapping up with a rundown of the latest Commitments of Traders data (pages 6 – 8).

See today’s full post-market Closer and everything else Bespoke publishes by starting a 14-day trial to Bespoke Institutional today!