Chart of the Day – Software is Eating the…Budget
Breadth Bombs
A frequent point of discussion this year has been breadth, or more specifically, the massive impact of mega caps on the market-cap-weighted S&P 500’s year-to-date performance (something we discussed in yesterday’s update of our Sector Weightings report). We often use the 10-day advance-decline (A/D) line to measure how breadth is evolving in the near term; highlighting these readings for the S&P 500 and its eleven sectors daily in the Sector Snapshot. This indicator essentially shows the average net percentage of daily advancers versus decliners in an index over a two-week period.
In the chart below, we show the S&P 500’s 10-day A/D line (expressed as standard deviations to clarify overbought/oversold levels) over the past year. The past week has seen a monumental shift in breadth. Just one week ago, the 10-day A/D line was deeply overbought sitting 1.72 standard deviations above the historical average, but as of yesterday’s close, it has fallen all the way into oversold territory; a 2.9 standard deviation drop in only four days.

Looking back to the start of our data in 1990, that is one of the largest four-day declines on record. In fact, the last time the line fell by such a degree or more was in September 2022 when there was a record decline.

While two-standard deviation declines have been uncommon, even fewer have resulted in the 10-day A/D line going from overbought to oversold. In the table below, we highlight those nine prior instances that have occurred with at least 3 months having passed since the last occurrence. The current period holds one of the higher starting readings in the 10-day A/D line. In fact, only November 2011 saw a higher reading.
As for S&P 500 performance going forward, returns have generally been mixed. One week after big ‘breadth bombs’ the index has actually risen better than three-quarters of the time, however, one month out has averaged a decline with positive returns less than half the time. Three months out to one year on have all averaged positive returns, but those are all weaker than the norm.


Bespoke’s Morning Lineup – 10/24/23 – Bitcoin Breakout
See what’s driving market performance around the world in today’s Morning Lineup. Bespoke’s Morning Lineup is the best way to start your trading day. Read it now by starting a two-week trial to Bespoke Premium. CLICK HERE to learn more and start your trial.
“Coming up with an idea is the least important part of creating something great.” – Larry Page

Start a two-week trial to Bespoke Premium now to get full access to the Morning Lineup.
Equity futures are trading higher for what seems like a change this morning after the S&P 500 has posted five straight days of losses. Positive earnings news seems to be driving the gains. We’re starting to see a heavier flow of larger companies report, and this morning’s batch has been generally better than expected. The real test will come after the close, though, as we’ll hear from Alphabet (GOOGL) and Microsoft (MSFT) after the close. Treasury yields and crude oil are generally behaving this morning, and the only data on the economic calendar is preliminary PMI readings for the Manufacturing and Services sectors, as well as the Richmond Fed Manufacturing Index.
After trading in a relatively tight range over the last six months and seeing its daily volatility converge to levels more in line with a long-term US Treasury, bitcoin prices have been rallying over the last few days, capping it off with a gain of nearly 10% today. Prices briefly surged past $35,000 overnight, and while they have pulled back from those highs, the world’s largest cryptocurrency is on pace for its highest close since May 2022. Optimism over approval for a spot ETF has been cited for the gain, but rising geo-political instability and concerns over sovereign debt loads can’t be ruled out either.

While prices got there briefly overnight, bitcoin is currently on pace to come up just short of a double-digit single-day percentage gain. Heading into today, the current streak without a one-day gain of at least 10% was 224 calendar days (bitcoin trades every day) which ranked as the longest streak since the 229-day streak that ended in November 2018. Before that, the only other streak that was longer was the 272 days ending in March 2017.

Sign up for a two-week trial to Bespoke Premium to continue reading more of today’s macro analysis.
The Closer – Earnings, Yield Reversal, Positioning – 10/23/23
Log-in here if you’re a member with access to the Closer.
Looking for deeper insight into markets? In tonight’s Closer sent to Bespoke Institutional clients, we begin with a recap of tonight’s earnings reports and the UAW situation (page 1). We then dive into the Chicago Fed’s Survey of Economic Conditions (page 2). We then review the reversal in 10 year yields (page 3) before previewing this week’s Treasury auctions (page 4). We finish with a look into the latest positioning data (pages 5 – 8).

See today’s full post-market Closer and everything else Bespoke publishes by starting a 14-day trial to Bespoke Institutional today!
Daily Sector Snapshot — 10/23/23
Please click the thumbnail image below to view today’s Daily Sector Snapshot.
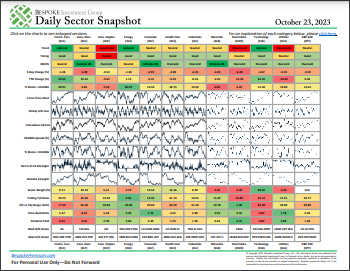
Chart of the Day: India Relative Strength
S&P 500 Sector Weightings Report – October 2023
Energy Energizes M&A Activity
The past few weeks have seen a boom in merger and acquisition news. For starters, what was approaching a two-year-long process of Microsoft (MSFT) buying Activision-Blizzard finally went through in what would be one of the largest M&A deals of the past five years and the largest in Microsoft’s history. On top of that, there have been a number of new announcements this month, primarily in the energy space. Earlier this month Exxon Mobil (XOM) proposed a $60 billion bid for Pioneer Natural Resources (PXD), and Chevron (CVX) followed suit today with a $53 billion bid for Hess (HES). Additionally, while nothing is official yet, last week there were reports that Marathon Oil (MRO) and Devon Energy (DVN) have been in talks.
In the charts below, we show the pending counts and nominal dollar values of M&A deals by month over the past decade. As shown, the past few months have seen the number of deals ramping up with a record amount of activity based on dollar values. Perhaps more impressive has been the dominance of the Energy sector in these M&A announcements. As shown in the second chart below, they have accounted for over 80% of the value of these deals, the highest amount of the past decade.

Nasdaq Corrections
After a lower open to start the week, stocks have staged a pretty big intraday recovery (so far). One catalyst for the rally was a tweet by Bill Ackman saying his firm had covered its Treasury short, citing too much geo-political risk and an economy weakening faster than current economic data suggests. Why a weaker economy would spur a rally in stocks is a legitimate question, but we’ve all certainly seen stranger things in the market, and when markets become oversold, sometimes it doesn’t take much to spark a rally. Monday’s rebound also coincided with the Nasdaq’s decline from the July closing high crossing the 10% threshold, and it’s not uncommon for an index in the midst of a decline to bounce at these round numbers as they are where bargain hunters will look to deploy some dry powder.
The Nasdaq is no longer officially in correction territory as we write this (10%+ decline from a closing high without a 10% rally in between), but we wanted to take this opportunity to look at historical trends for past Nasdaq corrections and see how the current period stacks up. For starters, since hints of the current rate hiking cycle began, there have been four prior Nasdaq corrections. Three of the four were deep with declines of more than 20%, while the most recent before the current period was more tame at just 11%.

Looking at Nasdaq corrections from a longer-term window, the scatter chart below shows corrections in terms of their magnitude (x-axis) and length (y-axis). Overall, the median decline of corrections since 1971 has been a drop of 16.6% over a median length of 61 calendar days. Through today’s close, the current decline is only around 10%, so it’s been a lot milder, but at 96 days, it’s already been 57% longer than the typical correction. If the current decline in the Nasdaq were to reach the median level for a correction, that would take it down to just below 12,000.
The Nasdaq is known for being more volatile than the S&P 500, and when it comes to corrections, they have tended to be steep as opposed to gradual. Even with respect to the corrections during the current rate-hike cycle, three of the four prior ones were shorter than the current period. The only one that was longer lasted 115 days from 11/19/21 through 3/14/22.

Bespoke’s Morning Lineup – 10/23/23 – “…Baby One More Time”
See what’s driving market performance around the world in today’s Morning Lineup. Bespoke’s Morning Lineup is the best way to start your trading day. Read it now by starting a two-week trial to Bespoke Premium. CLICK HERE to learn more and start your trial.
“Success is no accident. It is hard work, perseverance, learning, studying, sacrifice and most of all, love of what you are doing or learning to do.” – Pele
Start a two-week trial to Bespoke Premium now to get full access to the Morning Lineup.
After flirting with the 5% threshold for a number of days now, the 10-year yield finally traded above that level this morning but has retreated back below as we approach the opening bell. Equity futures aren’t thrilled with the move and are firmly lower in response. Besides higher interest rates, unrest in the Middle East, and some hesitancy heading into what will be a very busy week of earnings are contributing to the negative tone.
By now, we’re all familiar with the fact that the S&P 500 has had positive returns on each of the last 15 Mondays, which as shown in the chart below, is easily the longest streak since at least 1952 when the five-day trading week in its current format started. The prior record of eleven up Mondays ended in June 2005. Unfortunately for bulls, it’s looking as though that streak is set to end as S&P 500 futures are firmly lower. With today being the 25th anniversary of the release of Britney Spear’s “…Baby One More Time”, can we get the streak to 16?

As far as Mondays are concerned, the streak has been significant in terms of this year’s gains for the market. While the S&P 500 ended last week with a YTD gain of 10.02%, without Mondays, it would actually be down fractionally on the year. The “Magnificent Seven” have gotten all the credit for carrying the market this year, but “Magnificent Mondays” have been just as important.

Sign up for a two-week trial to Bespoke Premium to continue reading more of today’s macro analysis.