A Range Like Few Others
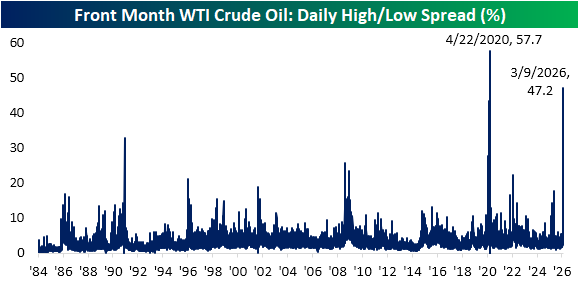
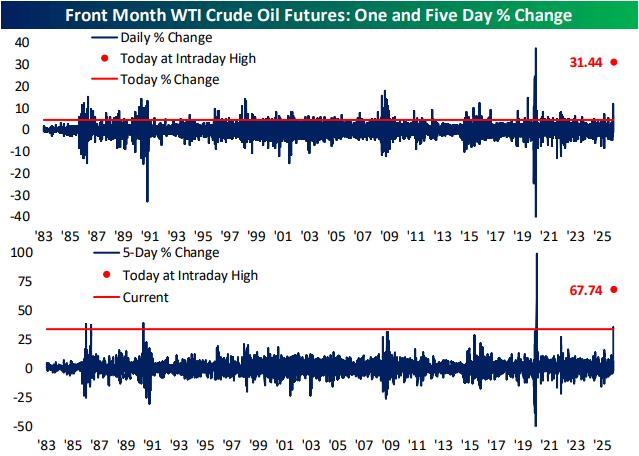
The situation in Iran, among other catalysts, has understandably raised volatility. As we discussed in today’s Chart of the Day, the S&P 500 (SPY) has been experiencing historic intraday moves so far this year, and of course, yesterday’s massive swings in crude oil prices are perhaps the prime example of heightened volatility. We highlighted in the Closer last night how front-month WTI went from trading just shy of $120 at its overnight highs Sunday, which would have been one of its largest daily gains on record. However, the steep drop in afternoon trading erased much of those gains. Today, the pullback has continued with another roughly 10% decline in both WTI and Brent futures. As shown below, the well over 40% intraday high and low range for crude prices yesterday made for WTI’s second largest intraday range in percentage terms. The only time with a wider intraday range was in the spring of 2020, around the time that prices briefly went negative. Even today, as the intraday high/low range has “moderated” to 10.5% for WTI as of this writing, that reading would rank in the 98th percentile of all periods since 1984.
Like this analysis? Join our premium members by starting a trial today! Click below for details on how to sign up:

Small Business Sales Surge
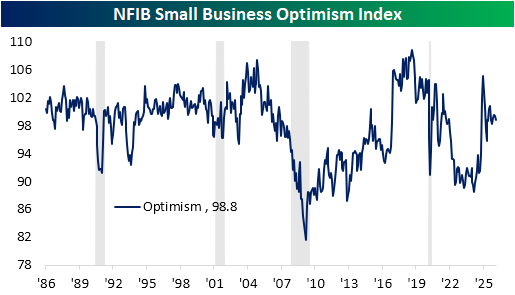
This morning, the NFIB published its latest update on small business sentiment. At 98.8, the headline Optimism Index came in below expectations of 99.6 and last month’s reading of 99.3. As shown below, current readings are now middling versus the recent range following the 2024 Election surge and all readings throughout the survey’s history. In fact, the current reading is just below the historical median ranking in the 45th percentile.
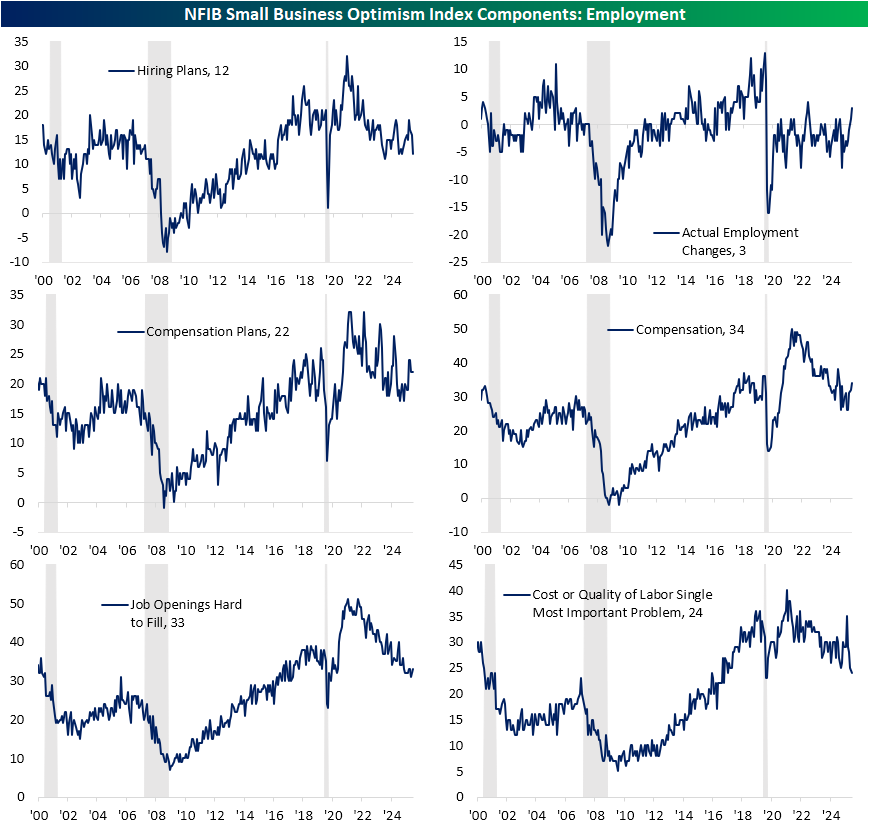
As we discussed in today’s Morning Lineup, labor-centric indices included in the NFIB report have suggested improvement over the past year, with another modest month-over-month increase most recently in February. Looking more closely, there are some interesting readings. For starters, hiring and compensation plans appear to be where there has been deterioration. While the latter was unchanged from recent highs in February, the former ranked as one of the larger declines across categories. Hiring plans dropped 4 points to the lowest level since May. Versus the reading of 16 last month, this index went from the 70th percentile down to below the historical median.
Despite those weaker readings in labor-related plans, actual labor changes were much more positive in February. For starters, actual employment changes came in net positive, which has been rare in the post-pandemic period. Further, that was the highest reading since February 2023. Compensation plans rebounded in tow to an eleven-month high. Finally, we would note that among the most important problem section of the report, the combined reading of the two labor-related problems was the lowest since May 2020.
Similar to how “actual” indices were stronger than “expectation” indices regarding labor, the same dynamic was apparent for sales and earnings. Actual sales and earnings both surged in February. Top-line changes were reported as net positive for the first time since May 2022. Actual earnings changes have rarely come in net positive over the history of the survey, but this index rose to the most elevated reading since December 2021.
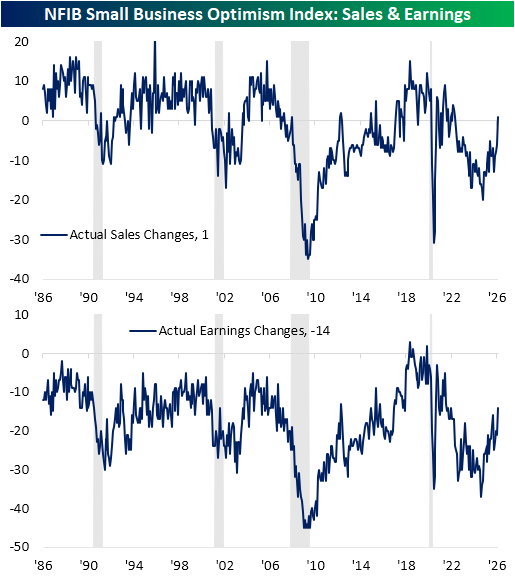
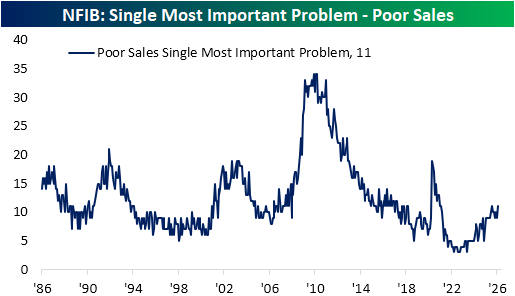
Ironically, the most important problem section again had an idiosyncratic reading versus the aforementioned actual sales change index. 11% of firms reported poor sales as their biggest issue, matching last July for the highest reading since February 2021.
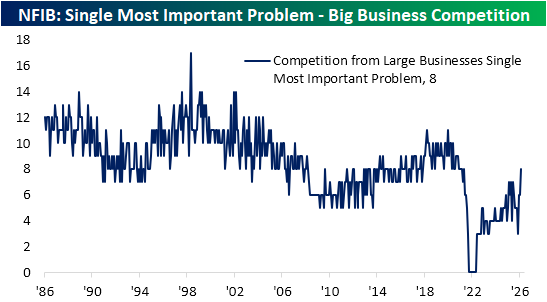
On the heels of the rise in poor sales concerns have been worries about competition from big business. As shown below, that problem has surged from negligible readings in 2022 to 8% of responses in February, the most since May 2021.
Like this analysis? Join our premium members by starting a trial today! Click below for details on how to sign up:
Chart of the Day – A High Friction Relationship
Bespoke’s Morning Lineup – 3/10/26 – The Whole is Worse than the Parts
See what’s driving market performance around the world in today’s Morning Lineup. Bespoke’s Morning Lineup is the best way to start your trading day. Read it now by starting a two-week trial to Bespoke Premium. CLICK HERE to learn more and start your trial.
“I think we’re at a bottom. I really do.” – Mark Haines, CNBC, 3/10/09

Below is a snippet of commentary from today’s Morning Lineup. Start a two-week trial to Bespoke Premium to view the full report.
After a dramatic reversal late in yesterday’s session on hopes that the war in Iran would be ‘complete’ soon, futures were higher for the overnight session and into this morning. As the opening bell approaches, though, futures have been drifting lower, and all of the major averages are on pace to open fractionally lower. Treasury yields are little changed, and crude oil has been volatile, sitting under $90 per barrel. While that seems low relative to Sunday night, it’s still much higher than anything seen in the months leading up to the war in Iran. Gold prices are up over 1.5%, and silver is surging 5% as it’s currently trading at the same price as WTI! Bitcoin has been quietly grinding higher over the last few days, and this morning, it’s above $70K.
Earnings season is largely in the rearview mirror, but after the close, we’ll hear from Oracle (ORCL), which could be a major catalyst tomorrow for different parts of the AI ecosystem. The only economic reports on the calendar today are small business optimism from the NFIB, which came in weaker than expected (98.8 vs 99.5), and then at 10 AM, we’ll get Existing Home Sales for February.
Asian markets followed the lead of the late-day reversal in US equities and traded sharply higher overnight. It wasn’t enough to entirely erase Monday’s losses, but the Nikkei rallied just under 3% while South Korea surged over 5%. Chinese stocks rallied a more modest 0.7%, and while February exports surged 39.6% y/y, exports to the US declined 17%. Those lost exports to the US were scattered across Europe and Southeast Asia, and many of those likely ended up finding their way into the US in a roundabout way. In Japan, GDP rose 0.3% q/q, which was higher than expected, and in South Korea, growth contracted less than expected.
European stocks are also sharply higher this morning as the US reversal occurred after those markets closed for trading yesterday. The STOXX 600 is up 2.3%, and Germany, Italy, and Spain are all up over 2% as well.
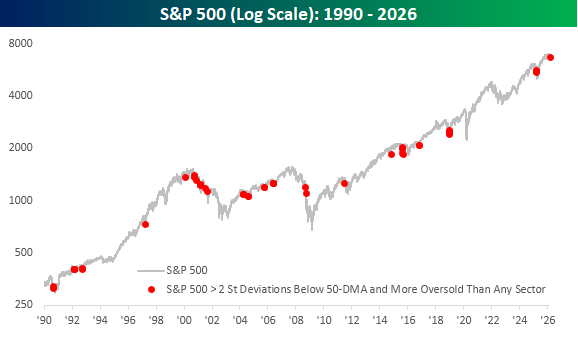
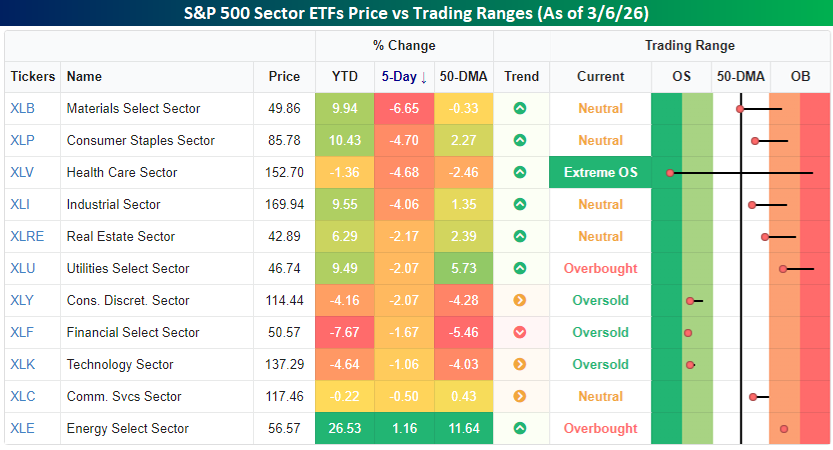
When you looked at page two of the Morning Lineup to see where sectors closed out last week relative to their trading ranges (image below), you may have done a double-take at seeing that the S&P 500 was in ‘extreme’ (2+ standard deviations) oversold territory and more oversold than any sector. In fact, the only other sector in extreme oversold territory was Health Care (after being in extreme overbought territory a week earlier), and just four other sectors were oversold while five were still above their 50-DMAs.

We were curious to see how often it is that the S&P 500 trades in ‘extreme’ oversold territory and is also more oversold than any other sector. Since sector data begins in 1990, there have only been 49 other days when this was the case, and a lot of them occurred during the dot-com bust from early 2000 to late 2001, but as the chart below illustrates, it’s hardly just a bear market phenomenon.
The Closer – Crude Craziness, Risk Bounce, Expectations – 3/9/26
Log-in here if you’re a member with access to the Closer.
- Markets continue to try to make sense of the Iran situation, making for a historic reversal today for crude prices.
- High volatility has showed that it works both ways with both crude and equities rebounding from sizable losses.
- Preliminary EPA estimates showed that nearly a third of consumer vehicles sold were EVs, hybrids, or fuel cell last year.
See today’s full post-market Closer and everything else Bespoke publishes by starting a 14-day trial to Bespoke Institutional today!
Daily Sector Snapshot — 3/9/26
Happy Birthday!
Just how low can stocks go? That was the question posed by the Wall Street Journal on Monday morning, March 9, 2009. Just like this year, March 9th fell on a Monday, following a Friday where the S&P 500 closed sharply lower on economic fears.
That’s where the similarities end. In 2009, the S&P 500 closed below 700 for the first time since 1996; this year, it’s trading not far below 7,000, or roughly ten times higher. Back then, strategists were debating if the index would crater another 27% to reach 500. Having already dropped 56% from its 2007 highs, another leg down felt entirely plausible, but in hindsight, it was the low. Compare that to today: when was the last time you saw mainstream analysts calling for a 27% drop, even with equities right near record highs?
The analysis from that article serves as a reminder of the investor tendency to extrapolate current trends into the future. If stocks are up, they’ll stay up; if they’re sliding, the bottom is always miles away. Analysts often add a ‘countertrend’ hedge in their forecasts just to cover their bases, but take today’s ‘temporary sell-off’ forecasts with a grain of salt. They’re only echoing what the market has been doing. The only way to know for sure is to watch, listen, and let the tape tell the story.
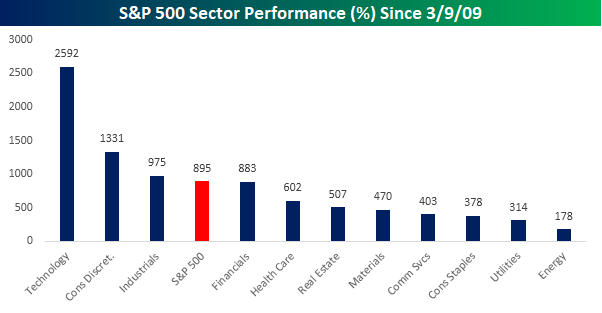
The ride since March 2009 has been incredibly rewarding for those who stayed the course. Since that Monday close, the S&P 500 has rallied 895% (excluding dividends), and more than half of all sectors have risen more than fivefold. Technology has been the top-performing sector with a gain of over 2,500%, followed by Consumer Discretionary, which is up by just over half of that amount. Rounding out the top three, Industrials is the only other sector that has outperformed the S&P 500 since the March 2009 low. While all eleven sectors are higher since March 2009, Energy (178%) and Utilities (314%) have been the worst performers, along with Consumer Staples (378%) and Communication Services (403%), which are the only other sectors that are up less than half as much as the S&P 500.
Have you ever heard anyone say that big gains are right around the corner? Of course not. Looking back at the last 17 years, it seems like the market has done nothing but go up. How many times have you heard someone say that the easy money has been made?
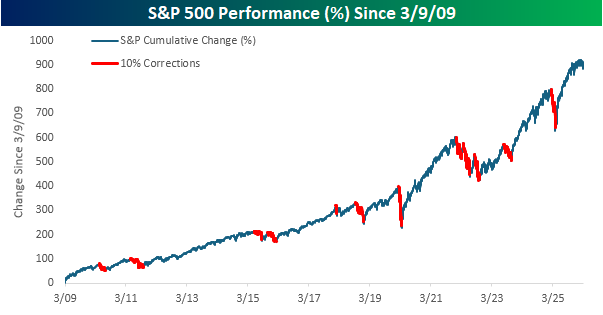
Investing always looks easy in retrospect, but in the moment, it never is. And the last 17 years? The S&P 500 has experienced two bear markets, three other near bear markets (-18%+ from a peak), and a total of 12 different declines of at least 10%. It’s nothing like the period from 2007 to 2009, but there were plenty of moments when putting new money into the market felt like anything but easy. That’s the trick. It’s only easy in retrospect.
Like this analysis? Join our premium members by starting a trial today! Click below for details on how to sign up:
Chart of the Day – 1%+ Downside Gaps
Bespoke’s Morning Lineup – 3/9/26 – It Doesn’t Get More Monday Than This
See what’s driving market performance around the world in today’s Morning Lineup. Bespoke’s Morning Lineup is the best way to start your trading day. Read it now by starting a two-week trial to Bespoke Premium. CLICK HERE to learn more and start your trial.
“There is no instance of a nation benefitting from prolonged warfare.” – Sun Tzu, The Art of War
Below is a snippet of commentary from today’s Morning Lineup. Start a two-week trial to Bespoke Premium to view the full report.
If there’s ever a day that feels like a Monday, today is it. As much as we may like daylight savings time for the later sunsets, we could do without the later sunrises after already missing an hour of sleep. Couple that with triple-digit oil prices and much lower equity prices, and we almost wish our alarms didn’t go off this morning.
Equity futures are down over 1% across the board this morning, treasury yields are higher with the 10-year yield now up to 4.17% (it was below 4% less than two weeks ago), and WTI crude oil is up over 10% to $102 per barrel. Incredibly, that’s down around 15% from just under $120 overnight. There’s been no flight to safety in gold either, as prices are down over 1% there too.
Equities in Asia plunged overnight, with the Nikkei down over 5%, while South Korea fell 6.0% after circuit breakers were triggered during the session. In China, CPI for February rose much more than expected, rising 1% after an increase of 0.2% in January. And that was before the spike in oil prices. European equities are also down more than the US. The STOXX 600 is down 1.6% with France down over 2% and Spain down just under 2%. We can try to read into different catalysts for the weakness, but it’s pretty much all oil. Until those prices stop rising, equity prices will continue falling.
The economic calendar is quiet today, and there will be no Fedspeak as the blackout period ahead of next week’s meeting started this weekend. The economic calendar will be very busy, though, with CPI on Wednesday, Jobless Claims, Housing Starts, and Building Permits on Thursday, and Personal Income and Spending, as well as GDP, among others, on Friday.
The war in Iran hasn’t had much of a benefit on any sector, except, of course, Energy. Since the fighting broke out just over a week ago, Energy has rallied over 1% while every other sector is in the red, with nine down more than 1%. Four sectors declined by over 4%, with Materials leading the losses at 6.65%, followed by Consumer Staples, Health Care, and Industrials. Health Care’s losses have taken that sector into ‘extreme’ oversold territory after trading in ‘extreme’ overbought territory just over a week ago. War has a way of changing market conditions very quickly!
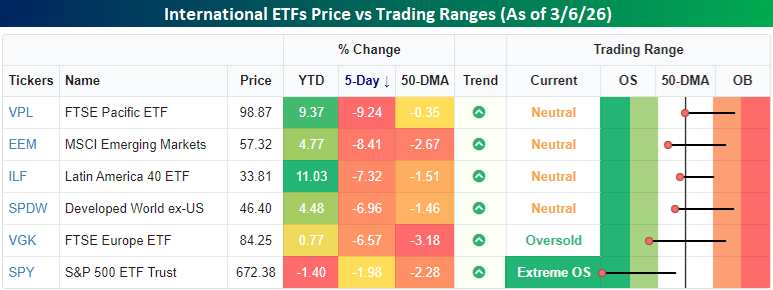
As bad as the US markets have been since the war broke out, it’s peanuts compared to the losses in the rest of the world. Below, we show the performance of various regional ETFs last week. While the S&P 500 was down nearly 2% last week, every other region of the world was down at least 6% and, in most cases, even more. Europe was down 6.6%, emerging markets were down over 8%, and stocks in the Asia Pacific region were down over 9%. As much as higher oil prices are a pain for US consumers and businesses outside of the Energy sector, other areas of the world are much more dependent on external sources for energy than the US.
In terms of the US vs. the rest of the world trade, the Developed World Ex US ETF was down nearly 7%, or five percentage points more than the S&P 500, in a week! As much as the US outperformed the rest of the world last week, it’s still significantly underperforming the rest of the world on a YTD basis (-1.4% vs +4.5%).
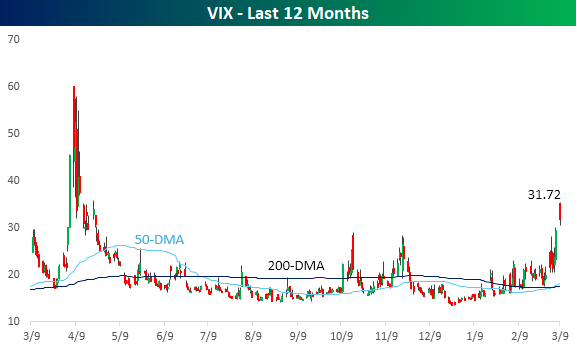
With the S&P 500 on pace to gap down 1% at the open for the fourth time in six days today, volatility has been on the rise, and the VIX is trading above 30 for the first time since last spring during the tariff-tantrum. Back then, though, the VIX briefly breached 60 before pulling back. So far during the current war, the highest the VIX has traded is 35.3. Last week may seem like a rough period for the markets, but relative to other points in just the last year, it could be a lot worse. The longer this conflict lasts and oil supplies remain disrupted, the more likely it is that conditions will worsen.
Brunch Reads – 3/8/26
Welcome to Bespoke Brunch Reads — a linkfest of some of our favorite articles over the past week. The links are mostly market-related, but there are some other interesting subjects covered as well. We hope you enjoy the food for thought as a supplement to the research we provide you during the week.
Malaysian Mystery: In the early hours of March 8, 2014, Malaysia Airlines Flight 370 departed Kuala Lumpur for Beijing with 239 people on board. Less than an hour into the flight, the Boeing 777 vanished from radar. Military radar later revealed that the plane had unexpectedly turned back across the Malay Peninsula and continued flying west before vanishing again. Satellite communication data later showed the aircraft continued transmitting automated signals for several hours, indicating it flew far off course along a remote arc over the southern Indian Ocean until it likely ran out of fuel.
The disappearance triggered the largest aviation search effort in history, involving more than two dozen countries and the scanning of roughly 120,000 square kilometers of ocean floor. Early search operations focused on the South China Sea before satellite analysis moved the search thousands of miles southwest into one of the most remote stretches of ocean on Earth. Despite years of underwater searches using advanced sonar equipment and deep-sea drones, the aircraft’s main wreckage has never been found.
Investigators explored numerous explanations for the disappearance, including mechanical failure, onboard fire, hijacking, or deliberate action by someone in the cockpit. Evidence that the aircraft’s communication systems were manually disabled and that it executed a controlled course change led many investigators to conclude the diversion was likely intentional, though the official investigation could not determine who was responsible or why. In 2015, a confirmed piece of MH370 debris, a wing component known as a flaperon, washed ashore on Réunion Island in the Indian Ocean, with additional fragments later discovered along the coasts of Africa and nearby islands. These findings strongly support the conclusion that the aircraft ultimately crashed into the southern Indian Ocean after flying for hours on autopilot. More than a decade later, the disappearance of MH370 remains one of aviation’s greatest mysteries.

AI & Technology
Jack Dorsey Blamed AI for Block’s Massive Layoffs. Skeptics Aren’t Buying It. (WSJ)
Block held a $60 million company celebration in California just months before announcing plans to cut roughly 40% of its workforce, with CEO Jack Dorsey pointing to rapid advances in artificial intelligence as a key reason for the restructuring. Some analysts and former employees argue the layoffs reflect years of overhiring and sprawling expansion into new ventures rather than an immediate AI-driven change in how the company operates. [Link]
Continue reading our weekly Brunch Reads linkfest by logging in if you’re already a member or signing up for a trial to one of our two membership levels shown below! You can cancel at any time.
