Bespoke’s Weekly Sector Snapshot — 4/25/24
Bears Come Out of Hibernation
The S&P 500 may have rebounded since this time last week, but sentiment has continued its slide. This week’s AAII Sentiment Survey saw only 32.1% of respondents report as bullish, the lowest percentage since 11/2/23. In total, bullish sentiment has declined 17.9 percentage points since just four weeks ago when it hit 50%. That is the largest drop since December 2021 for any given four-week span.

Given the drop in bulls, bears have picked up to 34%. However, that reading was little changed week-over-week with a modest 0.1 percentage point increase. Like bulls, this is the highest bearish sentiment reading since last November.

Although the increase in bearish sentiment has been less pronounced, the inverse moves with bullish sentiment have been enough to push the bull-bear spread into negative territory for the first time since 11/3.

The 24 consecutive weeks with a positive bull-bear spread was one of the longest streaks in the survey’s history and was tied with the 24-week streak that ended in July 2021 for the longest since 2015 (31 weeks). In all, there have only been 11 streaks that lasted at least 20 weeks in a row.


Chart of the Day – GDP: The Good, The Bad, & The Ugly
SPY Gaps Down by Weekday
US equity futures were already significantly lower on earnings weakness from Meta (META) prior to the 8:30 AM ET release of today’s key economic indicators, but they took another leg lower after Q1 GDP came in much weaker than expected and PCE came in hotter than expected. Weaker economic growth and higher inflation are certainly not bullish for equities.
With about 15 minutes to go before the opening bell at 9:30 AM ET, the S&P 500 ETF (SPY) is trading down more than 1% in the pre-market.
Below is a look at all prior gaps down of 1%+ at the open for SPY since it began trading in 1993. This would be the 352nd opening gap down of 1%+ for SPY in the last 31 years, and on average, SPY has traded up 0.09% from the open to the close on these days with positive returns 51.4% of the time.
This would be the 68th time that SPY has opened down 1%+ on a Thursday, and on Thursdays specifically, SPY has averaged an open-to-close decline of 0.10% with positive returns 47.1% of the time.
As shown in the table, Friday gaps down of 1%+ have historically been followed by the biggest intraday bounce-backs (+0.39%), while Monday has been the worst weekday for bounce-backs with an average open to close decline of 0.20% after 1%+ gaps down.

This will be the 14th time that SPY has gapped down 1%+ during the current bull market that began in October 2022. On these days, SPY has averaged an open-to-close gain of 0.21% on days when it gaps down 1%+. (That makes sense, though, since it’s a bull market.)

Bespoke’s Morning Lineup – 4/25/24 – Low Growth, Higher Prices
See what’s driving market performance around the world in today’s Morning Lineup. Bespoke’s Morning Lineup is the best way to start your trading day. Read it now by starting a two-week trial to Bespoke Premium. CLICK HERE to learn more and start your trial.
“Move fast and break things. Unless you are breaking stuff, you are not moving fast enough.” – Mark Zuckerberg

Below is a snippet of commentary from today’s Morning Lineup. Start a two-week trial to Bespoke Premium to view the full report.
After three days of gains, a fourth doesn’t look likely today. The largest drag this morning is Meta Platforms (META) which is down over 15% after the company announced that Q2 revenues would be at the low end of prior forecasts and that expenses would rise more than expected. META isn’t in the Dow, so it’s not to blame for the 300+ point decline in those futures, but a 4% decline in shares of Caterpillar (CAT) and a 9% drop in shares of IBM are making their presence felt.
Besides the slew of earnings reports last night and this morning, we also have a lot of economic data to contend with. At 8:30, Q1 GDP, Personal Consumption, Core PCE, Wholesale Inventories, and Jobless Claims were all released. While jobless claims were better than expected, GDP came in weaker than expected (1.6% vs 2.5% estimate) but inflation readings were higher than expected, and that was followed by another leg lower in the futures. At 10 AM, the latest update on Pending Home Sales will be released followed by the 11 AM report on manufacturing from the KC Fed.
When it comes to breaking things, one thing Mark Zuckerberg has broken more than a few times is his company’s stock price. Based on where the stock is trading today, the market cap of META is on pace to decline by more than $100 billion for the third time in 2018 and the second time since the start of 2022. While all but a small number of companies in the world could only dream of reaching a market cap of $100 billion, META loses that much money in market cap about once every other year! That’s not to say that shareholders are upset with these declines- at least they shouldn’t be. Shareholders are feeling a bit bruised this morning, but from the start of 2018 through yesterday’s close, META’s stock is up 180% which is just about double the gain in the S&P 500. That margin of outperformance is narrower this morning, but there’s still a wide gap.
The chart below shows the one-day change in market cap in reaction to META earnings reports since the start of 2018. As mentioned above, today’s decline will be the third time that the company lost $100 billion in market cap in a single day. That includes the largest ever one-day decline for any US stock ($232 billion) in February 2022 (according to Investopedia). Besides the big one-day declines, META also owns the bragging rights to the second-largest ever single-day increase in market cap (according to Bloomberg) when it saw its market cap increase by $197 billion this past February. The only company ever to see a larger one-day increase in market cap was Nvidia (NVDA) when it added $277 billion also in February.

In pre-market trading, shares of META are around $423 per share which is down sharply from its recent highs, and also right in the middle of its gap from February. To fill that gap, META would have to trade down an additional 3%.

Given its enormous market cap, META’s decline is contributing to a decline of nearly 1% in the Nasdaq 100 this morning. That would only take the ETF back to a level it was trading at on Monday, and the next level of support doesn’t come into play until about $412, or about 2.5% below current levels. With stocks like Alphabet (GOOGL) and Microsoft (MSFT) due to report earnings after the close today, we should find out soon if those support levels will come into play.
Continue reading today’s Morning Lineup.

For much more analysis of global equities and economic readings released this morning, read today’s full Morning Lineup with a two-week Bespoke Premium trial.
The Closer – Immigration & Labor Supply, META Earnings, EIA – 4/24/24
Log-in here if you’re a member with access to the Closer.
Looking for deeper insight into markets? In tonight’s Closer sent to Bespoke Institutional clients, we start out with a look into the dynamics of immigration and labor supply (page 1). We then review the latest earnings reports including those of Meta Platforms (META) (page 2). Next, we look at durable goods orders (page 3) before closing out with recaps of the 5 year note auction (page 4) and EIA inventory data (page 5).

See today’s full post-market Closer and everything else Bespoke publishes by starting a 14-day trial to Bespoke Institutional today!
Daily Sector Snapshot — 4/24/24
Fixed Income Weekly — 4/24/24
Searching for ways to better understand the fixed income space or looking for actionable ideas in this asset class? Bespoke’s Fixed Income Weekly provides an update on rates and credit each week. We start off with a fresh piece of analysis driven by what’s in the headlines or driving the market in a given week. We then provide charts of how US Treasury futures and rates are trading, before moving on to a summary of recent fixed-income ETF performance, short-term interest rates including money market funds, and a trade idea. We summarize changes and recent developments for a variety of yield curves (UST, bund, Eurodollar, US breakeven inflation, and Bespoke’s Global Yield Curve) before finishing with a review of recent UST yield curve changes, spread changes for major credit products and international bonds, and 1-year return profiles for a cross-section of the fixed income world.

Our Fixed Income Weekly helps investors stay on top of fixed-income markets and gain new perspectives on the developments in interest rates. You can sign up for a Bespoke research trial below to see this week’s report and everything else Bespoke publishes for the next two weeks!
Click here and start a 14-day free trial to Bespoke Institutional to see our newest Fixed Income Weekly now!
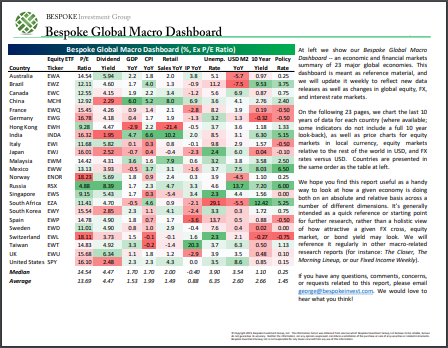
Bespoke’s Global Macro Dashboard — 4/24/24
Bespoke’s Global Macro Dashboard is a high-level summary of 22 major economies from around the world. For each country, we provide charts of local equity market prices, relative performance versus global equities, price to earnings ratios, dividend yields, economic growth, unemployment, retail sales and industrial production growth, inflation, money supply, spot FX performance versus the dollar, policy rate, and ten year local government bond yield interest rates. The report is intended as a tool for both reference and idea generation. It’s clients’ first stop for basic background info on how a given economy is performing, and what issues are driving the narrative for that economy. The dashboard helps you get up to speed on and keep track of the basics for the most important economies around the world, informing starting points for further research and risk management. It’s published the last Wednesday of every month at the Bespoke Institutional membership level.
You can access our Global Macro Dashboard by starting a 14-day free trial to Bespoke Institutional now!