Bespoke Market Calendar — July 2019
Please click the image below to view our July 2019 market calendar. This calendar includes the S&P 500’s average percentage change and average intraday chart pattern for each trading day during the upcoming month. It also includes market holidays and options expiration dates plus the dates of key economic indicator releases. Start a two-week free trial to one of Bespoke’s three premium research levels.

B.I.G. Tips – July 2019 Seasonality
Trend Analyzer – 6/28/19 – Teetering On Overbought
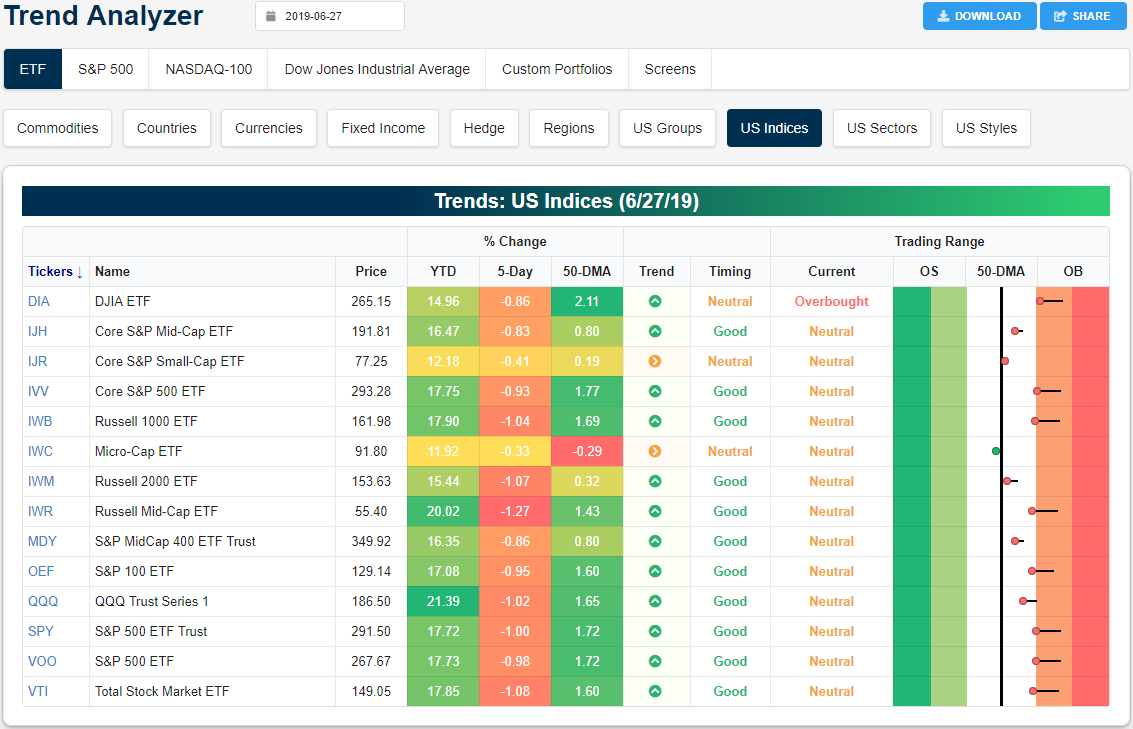
After the S&P 500 (SPY) set a new all-time high last Thursday, stocks have yet to make a push back above these levels as all of the major index ETFs sit below where they were at last Thursday’s close. This pullback was partially a function of the large-cap major index ETFs like the Russell 1000 (IWB) working off overbought levels. Whereas all of these were overbought last week, currently only the Dow (DIA) still sits in overbought territory although other large caps are teetering on joining DIA. The Core S&P Small Cap (IJR) and Micro Cap (IWC) are only lower by 0.41% and 0.33%, respectively. These are smaller losses compared to other ETFs which lost around 1%. Ironically, this outperformance also comes as IJR and IWC are now showing sideways trends rather uptrends across the rest of the ETFs. Granted, not all small-cap indices have been outperforming. Another small-cap index, the Russell 2000 (IWM), has seen performance more inline with other ETFs, declining 1.07%.
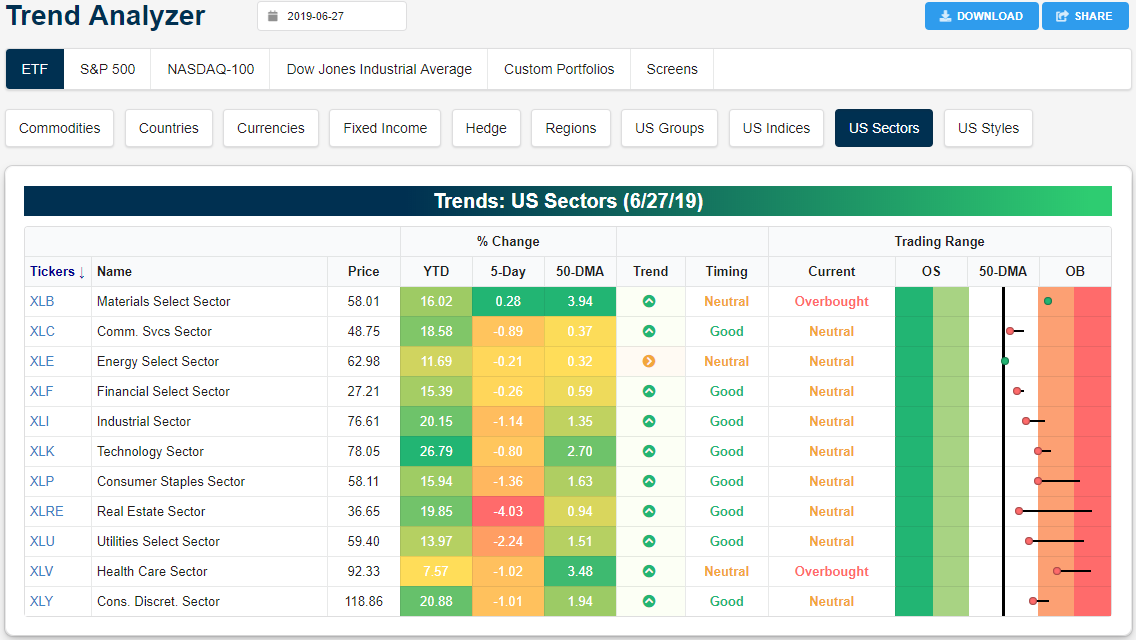
Every sector except Materials (XLB) is lower over the last week. As shown in our Trend Analyzer snapshot below, it’s the defensives that are finally lagging, with Real Estate (XLRE) down 4% and Utilities (XLU) down 2% since last Thursday’s close. At the moment, only Materials and Health Care are overbought, while the rest are neutral. Start a two-week free trial to Bespoke Institutional to access our Trend Analyzer and much more.
Morning Lineup – Partying Like it’s 1995
Why party like it’s 1999, when you can party like it’s 1995 instead? With futures indicated higher on the day, the S&P 500 is on pace to finish the first half with a gain of over 18%, while long-term US Treasuries are flirting with a gain of over 10% on the year. Heading into the last trading day of the half, the major focus is obviously on the weekend meeting between President Trump and President XI. Expectations are low heading into the meeting, but we should have a better idea of how things are going to play out as the day goes on and into tomorrow. To bad Xi doesn’t have a Twitter account too!
While China trade talks are a major issue, there is also a decent amount of economic data to contend with today and into next week. Then, after the July 4th weekend, we’ll start to kick off second-quarter earnings season.
Read today’s Morning Lineup to get caught up on everything you need to know ahead of the new trading day including a recap of overnight trading in Asia and Europe as well as a rundown of all economic data released.
Bespoke Morning Lineup – 6/28/19

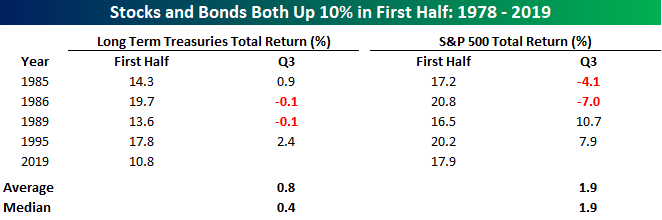
As mentioned above, 2019 is on pace to be the first year since 1995 where both long-term Treasuries (as measured by the Merrill Lynch Long-Term Treasuries Total Return Index) and the S&P 500 were up more than 10% in the first half of the year. Going back to 1978, this is also only the fifth year where both saw double-digit gains in the first half.
In the table below, we highlight each of those five years and show the performance of both asset classes in Q3. In the case of both asset classes, Q3 saw middling returns with periods of positive and negative returns evenly split.
Start a two-week free trial to Bespoke Premium to see today’s full Morning Lineup report. You’ll receive it in your inbox each morning an hour before the open to get your trading day started.
The Closer – Bond Divergence, Ford Flopping, Comfort Climbing, Five Fed Flop – 6/27/19
Log-in here if you’re a member with access to the Closer.
Looking for deeper insight on markets? In tonight’s Closer sent to Bespoke Institutional clients, we kick things off with a look at some bearish technical divergences in interest rate markets as well as a look at Ford (F) given the announcement of a reorganization of the company’s European activities. We then look at Bloomberg’s Consumer Comfort Index which came in at the highest level in 20 years. We finish with a final look at our Five Fed Manufacturing Composite for June with the release of the Kansas City Fed’s Activity index.

See today’s post-market Closer and everything else Bespoke publishes by starting a 14-day free trial to Bespoke Institutional today!
Bespoke’s Sector Snapshot — 6/27/19
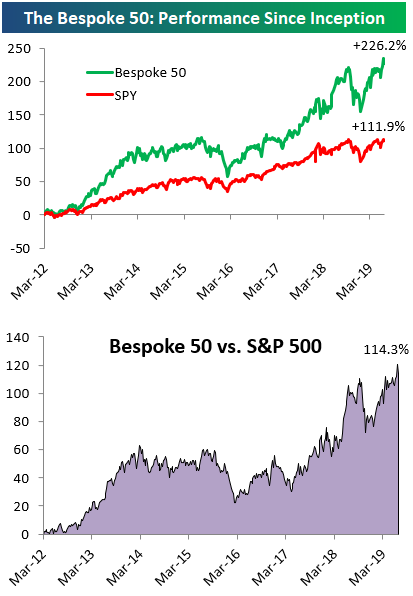
The Bespoke 50 Top Growth Stocks
Every Thursday, Bespoke publishes its “Bespoke 50” list of top growth stocks in the Russell 3,000. Our “Bespoke 50” portfolio is made up of the 50 stocks that fit a proprietary growth screen that we created a number of years ago. Since inception in early 2012, the “Bespoke 50” has beaten the S&P 500 by 114.3 percentage points. Through today, the “Bespoke 50” is up 226.2% since inception versus the S&P 500’s gain of 111.9%. Always remember, though, that past performance is no guarantee of future returns.
To view our “Bespoke 50” list of top growth stocks, please start a two-week free trial to either Bespoke Premium or Bespoke Institutional.
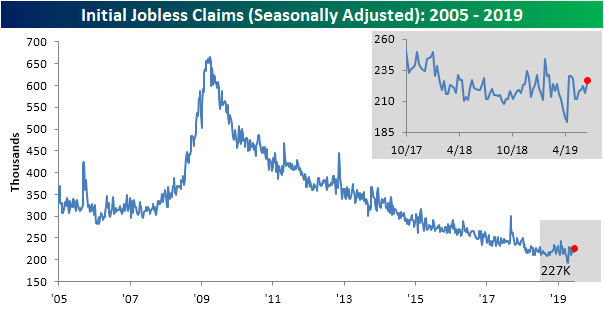
Jobless Claims Move Higher But Still Break a Record
The Department of Labor’s weekly Initial Jobless Claims released this morning showed a 10K increase from last week’s upwardly revised reading of 217K. Now at 227K, claims are at their highest level since May 3rd when they were slightly higher at 228K. This brings the indicator towards the upper end of the past year’s range, but claims also still remain very low historically. This week marked a record 90 weeks that claims came in at or below 250K. The previous record stood at 89 weeks ending January 10th, 1970. Additionally, the streak of readings at or below 300K rises to its 225th consecutive week.
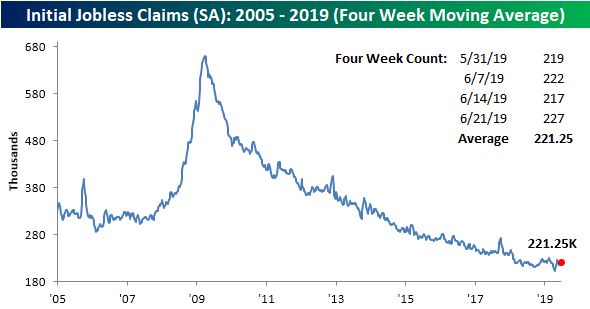
The less volatile four-week average also moved slightly higher this week rising to 221.25K from 219K last week. Like the weekly data, the moving average currently sits at the upper end of its range from the past year and the last time it made a new low was back in April. As the moving average is off of these recent lows, it has also moved higher YoY for the ninth week in 2019. In 2018, there wasn’t a single week with a YoY increase and over the course of all of 2017, there were only 5 weeks with YoY increases.
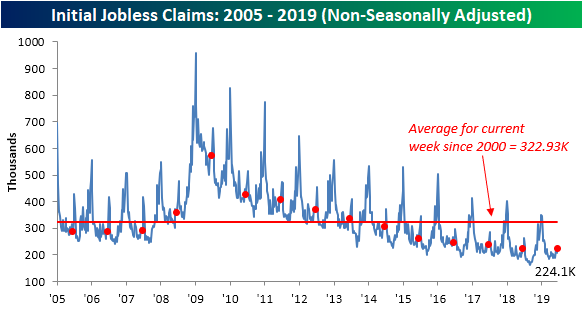
Non-seasonally adjusted (NSA) jobless claims saw yet another year-over-year increase as claims rose to 224.1K versus 222.8K one year ago. Now just about halfway through 2019, there have been ten weeks with a YoY increase in the NSA data (this is the same case for the seasonally adjusted data as well). Like the moving average, for this point in the year, this is a significant increase in the frequency of these increases from prior years. For reference, over the course of all 52 weeks in the entire year, 2018 only had two weeks and 2017 only had seven weeks with a similar YoY increase. In other words, labor market data is still at a strong level—NSA data is still well below the average for the current week since 2000, SA data has held onto impressive streaks, etc.—but it also has not been improving at anywhere near the same rate as we saw in 2017 and 2018. Start a two-week free trial to Bespoke Institutional to access our interactive economic indicators monitor and much more.
US Falls to the Bottom of the Pack
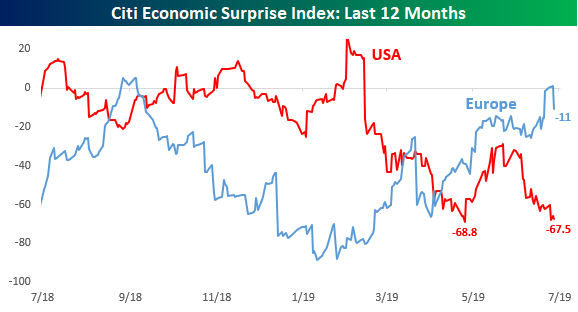
In a post earlier this week, we provided an update to the Citi Economic Surprise indices broken out by region. With economic data in the US continuing to disappoint this week, the Citi Surprise index (percentage of economic indicators that are beating vs. missing estimates) for the US is coming increasingly close to taking out its late April low and declining to its lowest levels in two years. What’s also notable about the current reading is that at the most recent reading of -67.5, the surprise index for the US is more negative than any other country or region that this series tracks.
Below we compare the Citi surprise reading for the US and Europe over the last twelve months, and what a reversal it has been. Heading into 2019, economic data in the US was coming in much better relative to expectations versus Europe, but ever since then, data in the US has been getting progressively worse relative to expectations, while data in Europe has been consistently improving. Start a two-week free trial to Bespoke Institutional to access our interactive economic indicators monitor and stay on top of all the latest economic trends.
Sentiment Still Not Buying the Highs
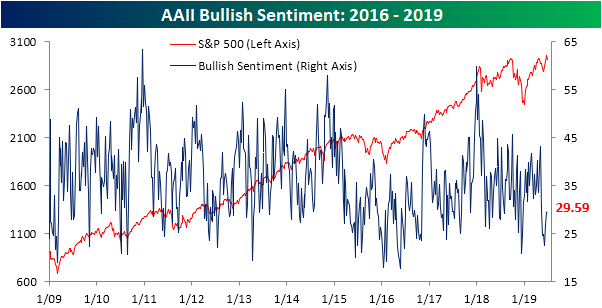
As the S&P 500 moved up towards an all-time closing high last week, we noted bullish sentiment levels were relatively muted in spite of this price action. We also highlighted that it is not exactly common for the market to reach new highs when sentiment is this subdued. But as the S&P 500 reached those new all-time highs one week ago today—followed by several sessions of selling—investors haven’t been excited by the new highs. This week’s AAII survey of investors showed hesitation more than anything with very small changes across the board. The percentage of investors reporting as bullish rose only 0.08% to 29.59%. Bullish sentiment saw a similar sized move only one month ago when it had risen from 24.71% to 24.79% in the final week of May. Given these readings, bullish sentiment remains at the lower end of its normal range sitting over 8.5 percentage points from the historical mean.
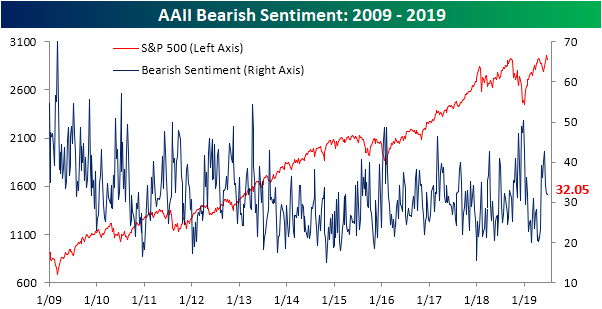
Bearish sentiment perfectly mirrored bullish sentiment this week as the percentage of investors pessimistic investors falling by just 0.08% to 32.05% and still above the historical average of 30.32%.
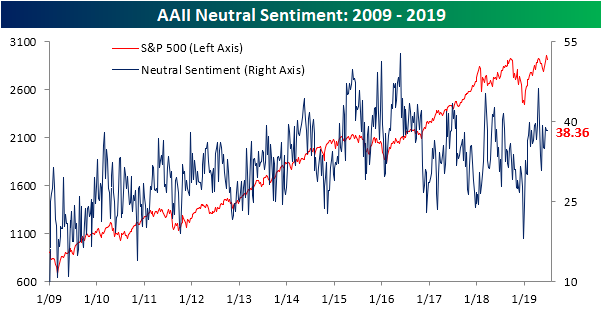
Neutral sentiment was completely unchanged this week. Holding firm at 38.36%, this was the first time that neutral sentiment saw no change since February 26, 2009. Like bearish sentiment, while off of recent highs, neutral sentiment remains elevated above the historical average of 31.5%.
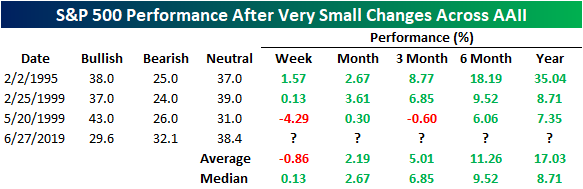
Again, across the board, the changes in sentiment levels in the AAII survey were very small this week. In fact, bullish, bearish, and neutral sentiment all simultaneously moving less than 0.1% is something that rarely has happened in the history of the survey. This was the first occurrence in over 20 years. The prior times this has occurred, twice in 1999 and once in 1995, all saw no change in these readings week-over-week (prior to 2000, AAII readings weren’t expressed in decimals). While it is a small sample size, forward performance has generally leaned positive going forward, although we wouldn’t put much weight into it.Start a two-week free trial to Bespoke Institutional to access our interactive economic indicators monitor and much more.