Nike (NKE) Ready to Jump On Earnings?
After the bell today, Nike (NKE) is scheduled to report third-quarter results. The stock has been pretty flat over the past six months swinging between ~$89 and ~$76, although, it has put in a series of higher lows since the start of 2019. Earlier this month marked yet another failed attempt (third time testing these levels) of NKE to break out, but over the past few weeks since that test of resistance, the stock has been coiling not far off these levels. All of this is in the context of a longer-term uptrend over the past couple of years, which means a solid earnings report could be just the catalyst needed to send the stock to new highs.

NKE is forecasted to report EPS of 71 cents and revenues of $10.4 billion. If the company meets these top-line estimates, it would be a record sales figure, representing a 4.88% growth rate YoY. In regards to EPS though, NKE is coming off of a disappointing quarter. Looking at the past several years of earnings data for NKE in our Earnings Explorer, after 27 consecutive quarters with an EPS beat, the company missed estimates by 4 cents back in June. Despite this, the stock price did not see any excessively negative reaction. In fact, NKE traded up 0.35% on its earnings reaction day which is not necessarily unusual as the stock’s price reaction to earnings has historically held a positive bias. On average, NKE has finished the day after earnings higher by 1.55% and has been positive 63% of the time. Start a two-week free trial to Bespoke Institutional to access our interactive Earnings Explorer and much more.

B.I.G. Tips – Fleeting Confidence
Bespoke Stock Scores — 9/24/19
Gas Price Surge Slows
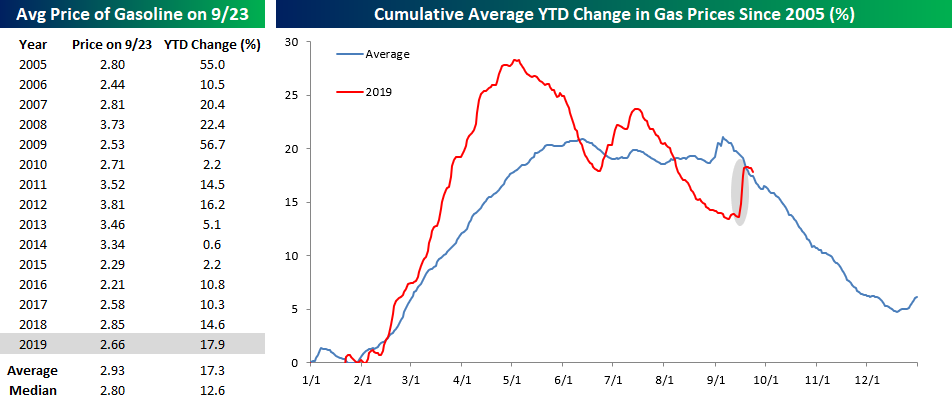
While last week’s surge in oil prices after the attacks on Saudi Arabian oil facilities stoked concerns of a spike higher in gas prices, the rally has already started to fizzle out. As of yesterday, the national average price of a gallon of gas was $2.66, and while that’s ten cents higher than where prices were before the attacks, we’ve already started to see prices ease for three days in a row now. With a YTD gain of 17.9%, this year’s move has now been slightly above the historical average (17.3%) dating back to 2005 and well above the median of 12.6%.
The chart to the right compares the change in gas prices so far this year to a composite of the YTD change for all years since 2005. Prior to the attacks in Saudi Arabia, prices were trending modestly below the historical average, but now prices are right in line with the historical average. If the pattern continues to hold, we should see prices resume their downward trend from now until year-end.
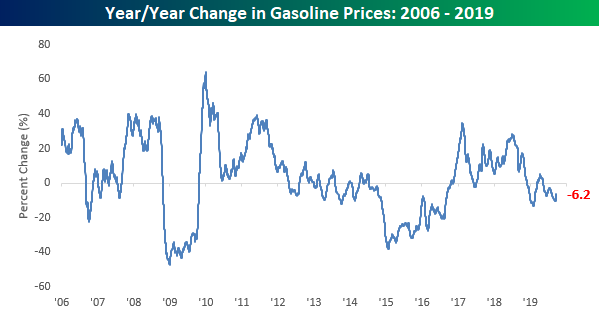
Given the seasonal nature of gas prices, where they are now versus six months ago probably isn’t as important as the year/year change. If prices are lower now than they were at this time last year, consumers will feel more flush while higher prices may crowd out spending in other areas. After about two years where gas prices were consistently higher on a y/y basis, we’ve recently seen a trend where prices have been down modestly. While the decline probably hasn’t been big enough to have a big impact, at the margin, consumers have seen a bit of a tailwind from lower prices. Start a two-week free trial to receive our market research and access our interactive tools.
Bespoke’s Morning Lineup – 9/24/19
See what’s driving market performance around the world in today’s Morning Lineup. Bespoke’s Morning Lineup is the best way to start your trading day. Read it now by starting a two-week free trial to Bespoke Premium. CLICK HERE to learn more and start your free trial.

Futures are indicated higher this morning, but equities have been in a bit of a holding pattern for the last week as all of the major index ETFs are down over the last five trading days and for the most part, hovering just below overbought levels.

The Closer – Golden Yields, Distressed Details, PMIs, Employment Breadth – 9/23/19
Log-in here if you’re a member with access to the Closer.
Looking for deeper insight on markets? In tonight’s Closer sent to Bespoke Institutional clients, we discuss the relationship between gold and yields, before reviewing the performance of the ten worst-performing stocks in the S&P 500. We also take a look at the rising number of distressed high yield issuers. In economic data, we discuss flash PMIs from Markit and the breadth of labor market strength in the US.

See today’s post-market Closer and everything else Bespoke publishes by starting a 14-day free trial to Bespoke Institutional today!
Netflix (NFLX) Round Trip
It has been quite a drama for Netflix (NFLX) in 2019. After being up nearly 50% YTD and one of the best performers in the S&P 500 back in early May, NFLX has given up all of its YTD gains, falling by nearly a third from its highs and putting the stock in the red for the year.

While the last five months have been pretty disastrous for Netflix (NFLX), it isn’t even the worst-performing stock in the S&P 500 since its closing high on 5/3. The table below lists the 19 S&P 500 components that have declined more than 25% since 5/3. Topping the list is DXC Technology (DXC), which has lost just under half of its value. Behind DXC, Align Technology (ALGN) is the only other S&P 500 stock that is down over 40% since 5/3. Outside of these two names, other notable names on the list of losers include retailers and retail-related names like Macy’s (M), Gap (GPS), PVH, Ulta Beauty (ULTA), Ralph Lauren (RL), Kohl’s (KSS), L Brands (LB), and Capri Holdings (CPRI).

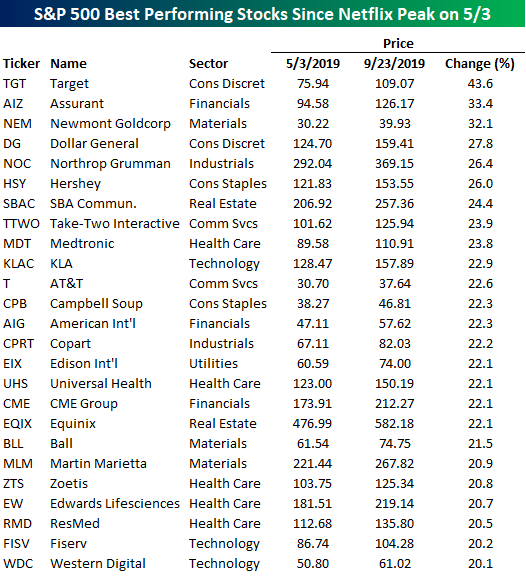
During the same span that Netflix (NFLX) has been giving up its YTD gains, a number of stocks have done quite well. The table below shows the 25 stocks in the S&P 500 that are up over 20% since NFLX’s closing high for the year. While the list of biggest losers is littered with retail-related names, Target (TGT) actually tops the list of winners with a gain of over 40%. As far as themes are concerned, though, the names are spread out across practically every different sector. Of the 25 names listed in the table, the only sector not represented is Energy, and besides Health Care which has five stocks on the list, no other sector accounts for more than three of the S&P 500’s top performers. Start a two-week free trial to receive our market research and access our interactive tools.
Dogs of the Dow 2019 Update
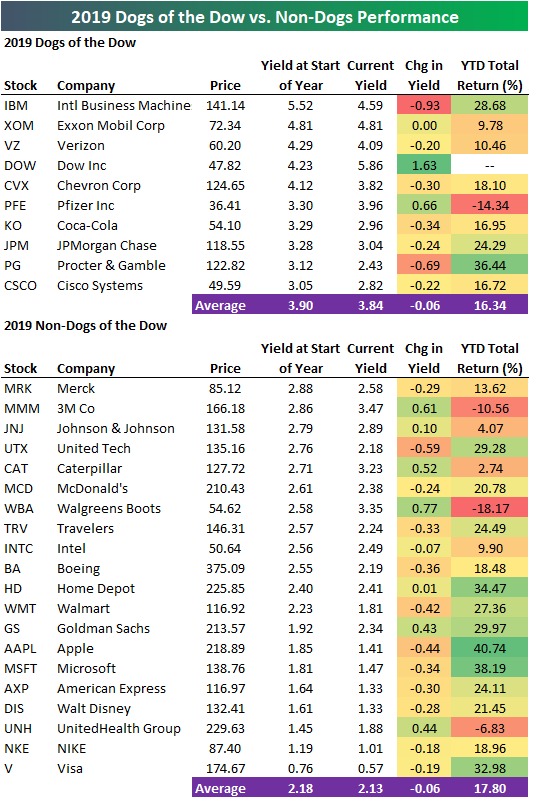
Below is an updated look at the total return performance of the 10 Dogs of the Dow for 2019 versus the 20 non-Dogs. As shown, the 10 Dogs are up 16.34% so far this year, which is 150 basis points less than the gain of 17.8% for the non-Dogs. Procter & Gamble (PG), IBM, and JP Morgan (JPM) have been the best performing Dogs, while Pfizer (PFE) has been the only loser with a YTD decline of 14.34%. Of the non-Dogs, Apple (AAPL) is up the most at +40.74%, followed by Microsoft (MSFT), Home Depot (HD), Visa (V), and Goldman Sachs (GS). Walgreens (WBA) is down the most of any Dow stocks with a YTD decline of 18.17%, while 3M (MMM) and UnitedHealth (UNH) are the only other names in the red.
Below is a look at total return performance for Dow members so far in 2019 as well as over the last 12 months. Year-to-date, these stocks are up 17.35%, but they’re up just 5.91% over the last 12 months. Apple (AAPL) is the top performing Dow stock in 2019 with a total return of 40.74%, but its total return over the last 12 months is just +2.24% because of its horrific performance in Q4 2018. Other stocks with big YTD gains but low or negative 12-month returns include Goldman Sachs (GS), United Tech (UTX), IBM, and JP Morgan (JPM).
There are three Dow stocks down 10%+ YTD (MMM, PFE, WBA) while there are six stocks that are down 10%+ over the last 12 months (XOM, CAT, UNH, MMM, PFE, WBA). Start a two-week free trial to receive our market research and access our interactive tools.

Chart of the Day: Phillips 66 (PSX)
Bespoke’s Morning Lineup — 9/23/19
See what’s driving market performance around the world in today’s Morning Lineup. Bespoke’s Morning Lineup is the best way to start your trading day. Read it now by starting a two-week free trial to Bespoke Premium. CLICK HERE to learn more and start your free trial.