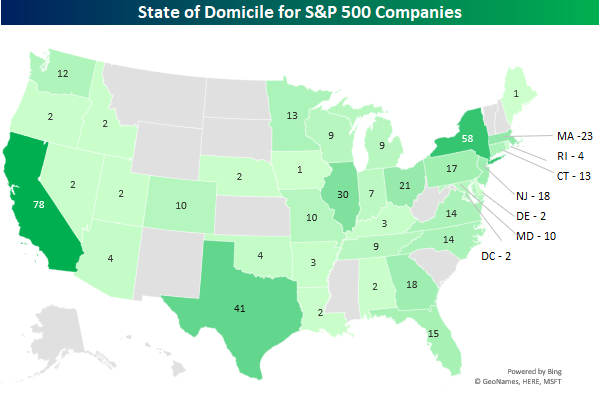
S&P 500 Company Performance By State
The map below provides a color-coded breakdown of the number of S&P 500 companies domiciled in each state across the USA. Not surprisingly, the biggest states in terms of population tend to have the largest number of S&P 500 companies headquartered in them. Leading the way, 78 companies are domiciled in California, followed by New York with 58, and Texas with 41. Meanwhile, there are 13 states which are home to no S&P 500 companies, including Alaska and Hawaii. In the case of those two states, the difference in time zone makes it understandable that no S&P 500 companies are headquartered there, but one would think a company with a name like Alaska Air would at least be located in Alaska, right? Illinois, which arguably has among the shakiest finances of any state, is home to 30 S&P 500 companies and that’s the fourth most even though it is only the sixth largest state. Among the biggest outliers, though, is Florida. Even though it has the third largest population of any state, only 15 S&P 500 companies call it home, ranking it all the way down at number ten. Start a two-week free trial to Bespoke for full access to our research.
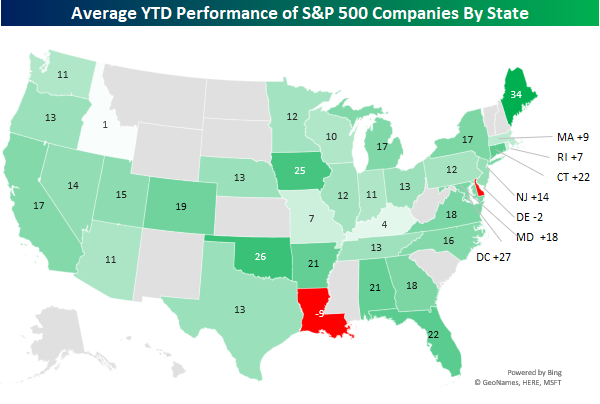
While the chart above shows the number of S&P 500 companies located in each state, the chart below shows the average YTD performance of the S&P 500 companies by state. Before going any further here, though, it is important to point out that these numbers can be a bit misleading since some states have a large number of companies while others just have one or two, thereby skewing the averages. With that in mind, Maine is the first state the sun touches each day, and it is also home to IDEXX Labs (IDXX) which is up 34% YTD, ranking it first of the 50 states. While Florida underperformed a bit in terms of the number of companies headquartered there, the average return of those companies is 22% YTD, ranking near the top in terms of states on the east coast.
Moving on to the midwest, the 30 companies headquartered in Illinois have underperformed the S&P 500 with an average gain of just 12% YTD. Further South, the fact that Louisiana (LA) is home to just two companies and one of them is Centurylink (CTL), which has declined 32% this year, makes it the state with the worst average return in the country. Right next door, Texas (TX) has a lot of exposure to the Energy sector among the 41 companies headquartered there and that has been a bit of a weight on its average YTD return of 13%. Finally, the dominance of Technology in California (CA) has the average stock headquartered in that state up 17% YTD as companies like Cadence (CDNS), Advanced Micro (AMD), and Facebook (FB) are all up over 40%.
Corn Planting-Pocalypse
US agricultural markets have been closely focused on the very slow pace of corn planting this year. The result was a 12% surge in corn prices for July delivery, under the assumption that wet weather and low prices would incentivize a small crop planting this year.
As shown in the left chart below, USDA observers report the crop is only 49% planted so far, the slowest pace since 1993, a year that saw corn harvests fall over 30% from the year before. That’s reason to suspect supply of corn will be light come harvest time, but it’s important to note that there’s not much historical relationship between corn planting progress in the 7th week of the season and the following year’s production growth versus the prior year. Start a two-week free trial to Bespoke Institutional to read more on commodity markets and the global macro backdrop.

Helen of Troy and Constellation Brands – A Perfect Match For Summer
Our Chart Scanner has become an incredibly popular and useful tool for clients as it gives a user the ability to quickly scan through hundreds of charts in order to find the most attractive (or unattractive) patterns. Included with the tool are a number of pre-defined screens that allow users to see, for example, stocks that just experienced a golden or death cross.
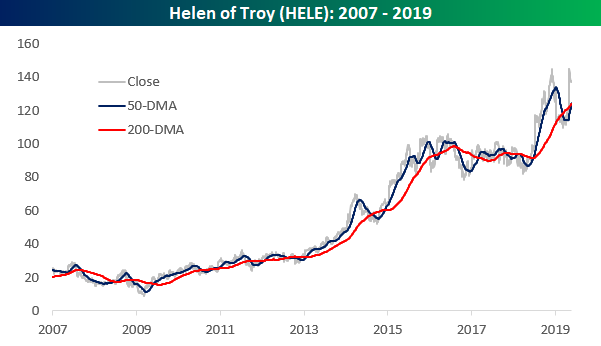
A Golden Cross occurs when a stock’s upwardly sloping 50-day moving average (DMA) crosses above its 200-DMA, which also has to be rising. Conversely, a Death Cross occurs when a downwardly sloping 50-DMA crosses below the 200-DMA, which also has to be moving lower. Technicians consider Golden Cross formations to be a positive signal, while a Death Cross is considered negative. Although it is valuable to look at Golden and Death Cross formations, as we have pointed out in the past, they are not always reliable buy or sell signals. With that caveat, though, today we wanted to highlight two recent examples of a Golden Cross formation where each stock tended to show positive returns going forward.
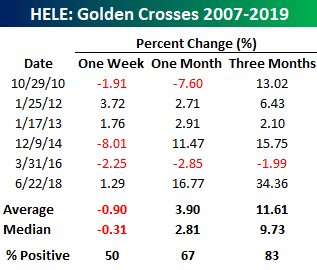
Below is our first example, Helen of Troy (HELE), which saw a Golden Cross yesterday. HELE is a producer of household goods and beauty products and also owns the wildly popular Hydro-Flask brand. While the stock has seen mixed returns in the short run following its six golden cross formations since 2007, over the following three months, HELE had positive returns five out of six times for an average gain of 11.61% (median: 9.73%).
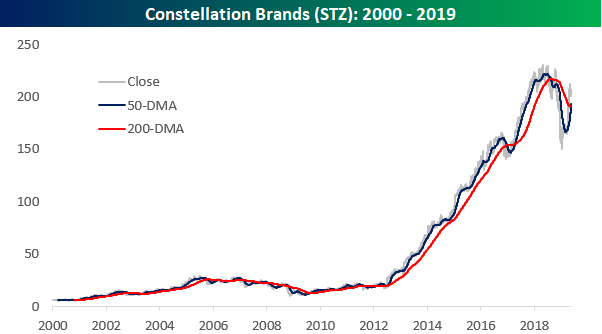
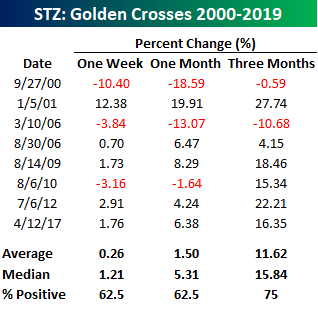
With summer around the corner, instead of water, you may just want to fill up your Hydro-Flask with your favorite cocktail, and Constellation Brands (STZ) has everything you’ll need on that front. The producer of various spirits, Corona beer, Mondavi wine, and many others also saw a Golden Cross yesterday. Similar to HELE, STZ has tended to see positive returns following prior golden cross formations going all the way back to 2000. Following five of the prior eight golden crosses for the stock since 2000, the stock saw positive returns over the following week and month, but three months later, STZ’s performance was even stronger with an average gain of 11.6% (median: 15.8%) and gains three-quarters of the time. Helen of Troy and Constellation Brands – a perfect match for summer!
For full access to our Chart Scanner tool and its daily screens, start a two-week free trial to Bespoke Premium now.
Fixed Income Weekly – 5/22/19
Searching for ways to better understand the fixed income space or looking for actionable ideals in this asset class? Bespoke’s Fixed Income Weekly provides an update on rates and credit every Wednesday. We start off with a fresh piece of analysis driven by what’s in the headlines or driving the market in a given week. We then provide charts of how US Treasury futures and rates are trading, before moving on to a summary of recent fixed income ETF performance, short-term interest rates including money market funds, and a trade idea. We summarize changes and recent developments for a variety of yield curves (UST, bund, Eurodollar, US breakeven inflation and Bespoke’s Global Yield Curve) before finishing with a review of recent UST yield curve changes, spread changes for major credit products and international bonds, and 1 year return profiles for a cross section of the fixed income world.
In this week’s report we take a look at the impact of software companies on credit markets.

Our Fixed Income Weekly helps investors stay on top of fixed income markets and gain new perspective on the developments in interest rates. You can sign up for a Bespoke research trial below to see this week’s report and everything else Bespoke publishes free for the next two weeks!
Click here and start a 14-day free trial to Bespoke Institutional to see our newest Fixed Income Weekly now!
Uptrends and New Highs
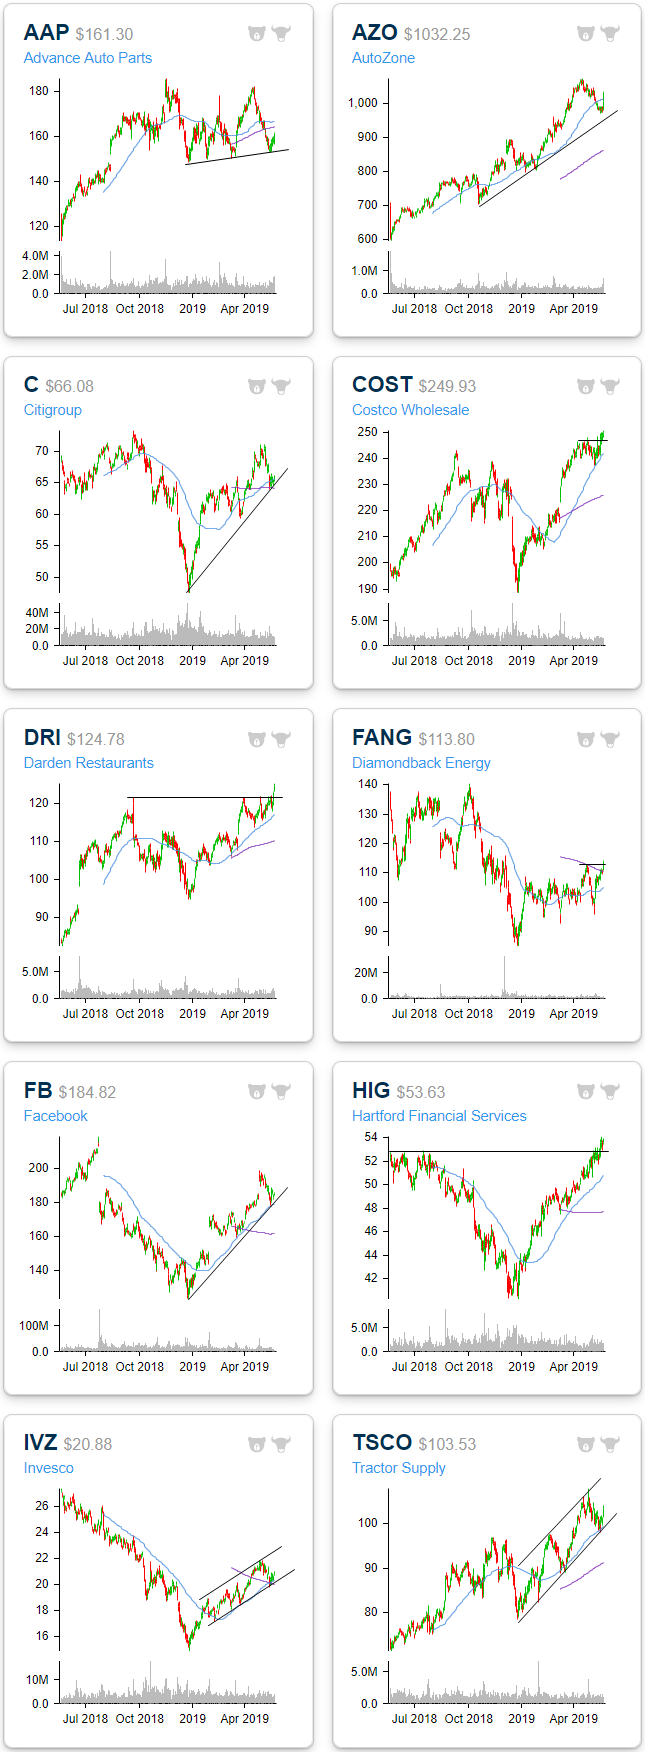
Using our Chart Scanner tool, members can quickly scan through price charts for hundreds of stocks across major US indices as well as a large array of ETFs. Below we highlight some stocks that are at interesting points.
Major auto part retailers Autozone (AZO) and Advance Auto Parts (AAP) both reported strong earnings yesterday morning and this morning, respectively. This has helped the stocks rally further after bouncing off of the lower end of their uptrends. Similarly, Tractor Supply (TSCO) is another specialty retailer that has seen a bounce from the bottom portion of this year’s uptrend channel. Yesterday’s trading also brought the stock out of the past month’s downtrend. Citigroup (C), Invesco (IVZ), and Facebook (FB) are also all at the bottom of their uptrends. One more retailer — Costco (COST) — has resumed its uptrend, breaking out to new 52-week highs recently after pulling back to the 50-DMA. Darden Restaurants (DRI) and Hartford Financial (HIG) have similarly broken above long term resistance to new 52-week highs. Start a two-week free trial to Bespoke Premium to access our popular Chart Scanner tool now.
Morning Lineup – May be Not
Ever since 6 AM this morning, US equity futures have been drifting lower, turning earlier gains into moderate losses. A number of catalysts are behind the weakness. For starters, US-China trade talks show no signs of improvement. Over in the UK, Thersa May’s latest plan for a Brexit deal is falling apart, and her job looks increasingly at risk. Here at home, there are also a number of negative data points. Qualcomm (QCOM) is sharply lower after a US judge ruled that the company’s business practices violate antitrust violations. Also, Lowe’s, VF Corp (VFC), and Nordstrom’s are all seeing big declines after reporting disappointing earnings.
We’ve just published today’s Morning Lineup featuring all the news and market indicators you need to know ahead of the trading day.

With the drama surrounding Brexit close to entering its fourth year now, it’s worth taking a look at the performance of UK equities since the initial vote back in June 2003. The chart below shows the performance of the FTSE-100 in dollar adjusted terms since the close on 6/23/16 – the day of the Brexit vote. Over that nearly three-year period, UK investors who have been long the FTSE are down just under 1% in price terms. While a decline of 1% is considerably better than the 16% decline we saw initially after the vote, essentially UK equities have been dead money for three years.

Start a two-week free trial to Bespoke Premium to see today’s full Morning Lineup report. You’ll receive it in your inbox each morning an hour before the open to get your trading day started.
The Closer — Cyclicals Smashed, Existing Home Sales, Eurozone Consumers, Corn — 5/21/19
Log-in here if you’re a member with access to the Closer.
Looking for deeper insight on markets? In tonight’s Closer sent to Bespoke Institutional clients, we begin with a look at the recent underperformance of cyclical stocks and explain what that means in regards to the global economy. Next we turn to today’s release of existing home sales which were weaker than expected. We also show stronger consumer confidence data in Europe. We finish by illustrating the very weak corn plantings so far this year.

See today’s post-market Closer and everything else Bespoke publishes by starting a 14-day free trial to Bespoke Institutional today!
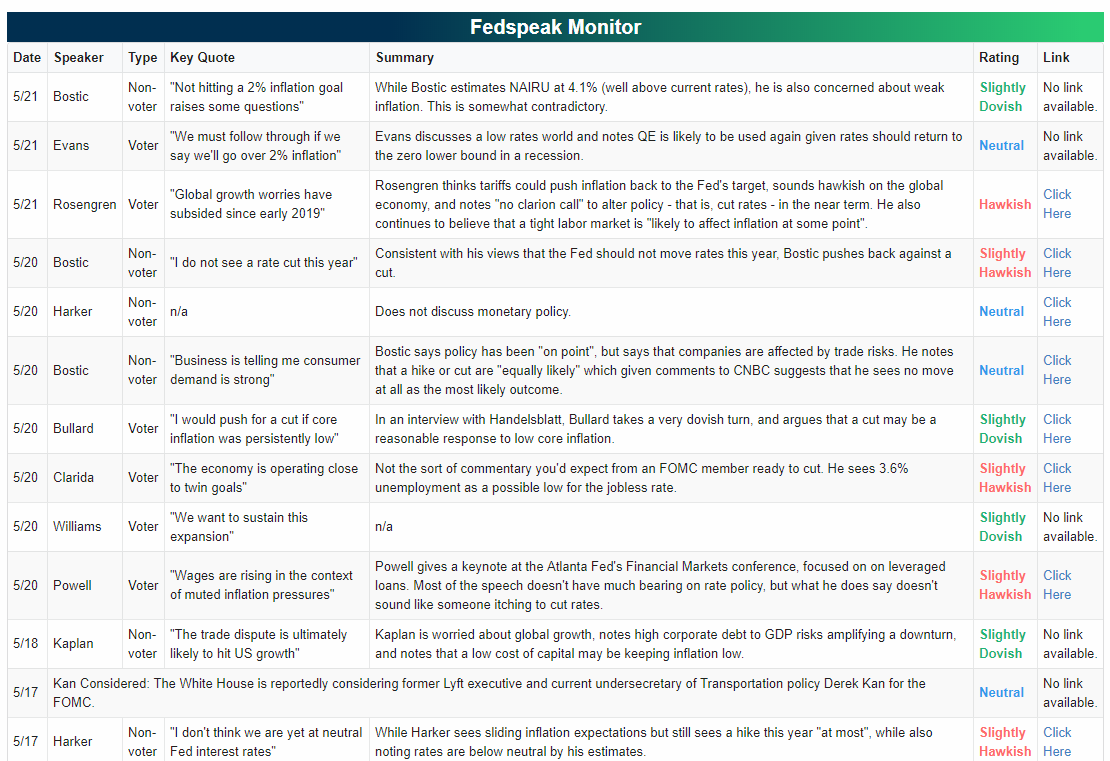
Keeping Track of Fedspeak And Global Central Banking
In addition to ad hoc discussion of Federal Reserve meetings, data releases, or important speeches, Bespoke’s coverage of US monetary policy includes regular summaries of all publicly available Federal Reserve speeches. Below we show a table of the most recent speakers including Chair Powell’s comments last night. Included with each speech or media appearance is a link to the original material, as well as a subjective rating about how hawkish or dovish it is (ranging from “Very Hawkish” to “Very Dovish”, with five other points in between). For example, today’s speech from Boston Fed President Rosengren was given a “hawkish” rating because he is more worried about tariffs’ impact on inflation than domestic economic activity or financial markets. He also suggests the global backdrop has improved significantly versus Q1, which isn’t very consistent with still-weak global data. This monitor is updated throughout the week to reflect new speakers as they make public communications. We also use its results to compile our Fedspeak Monitor Index, a rolling average of the rating we assign to each speech. That average tends to correlate well with changes in interest rates, offering a way to judge the performance of bond markets. Start a two-week free trial to Bespoke Institutional to keep on top of the latest speeches from FOMC members and upcoming global central bank meetings.
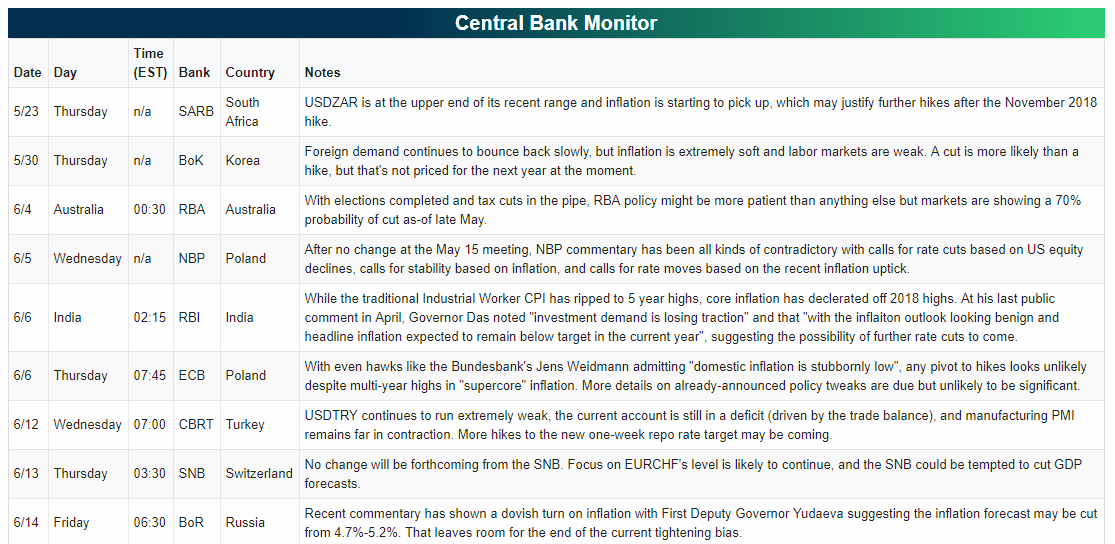
For investors looking to keep track of global central bank activity, we also have a forward-looking calendar of upcoming major central bank decisions. Similar to our Fedspeak Monitor, this Global Central Bank Monitor is updated regularly, allowing investors to be ready for upcoming policy decisions from central banks in both developed and emerging markets.
2019 Global Growth Forecasts: US at the Wheel
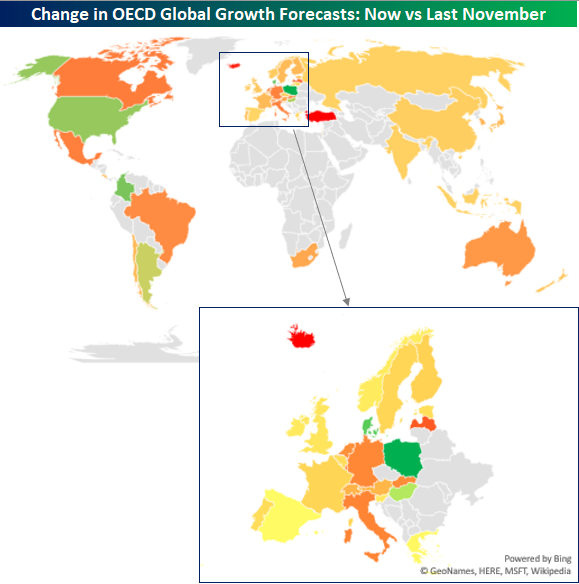
Given the increased friction over trade between the US, China and other countries around the world, concerns over global growth have been on the rise, and the latest revisions to global growth forecasts for countries in the OECD (Organisation for Economic Co-Operation and Development) reflect those concerns.
For the OECD as a whole, 2019 global GDP growth forecasts were cut from 2.12% in November to 1.78% now, marking a 36 basis point (bps) haircut. The map below shows the change in growth forecasts for each OECD country from November to now. Looking at the chart, there isn’t a whole lot of green. Besides the gray shading which indicates non-member OECD countries, most countries are colored in a shade of red to yellow. In fact, of the 45 countries shown, only six saw upgrades to their GDP growth forecasts, and none of the increases were all that significant as no country saw its growth forecast raised by more than 30 bps. On the downside, however, three countries (Turkey, Iceland, and Latvia) saw their growth forecasts slashed by more than a full percentage point, while another eleven saw growth estimates cut by more than half a percentage point! While no country saw an especially large increase in its growth forecasts, the US, which is by far the largest economy in the world, saw an upgrade to its growth forecast from 2.71% up to 2.82%. China, meanwhile, saw a cut in its GDP growth forecast from 6.2% down to 6.1%, a level of growth that most other global economies would kill for.
In the second chart below, we have zoomed in a bit on Europe since it is hard to see each country’s individual change in growth forecasts. For the region as a whole, growth forecasts were cut by a pretty sizable chunk, falling from 1.77% down to 1.22%. Countries in the Euro region that saw the largest downgrade to growth forecasts were Iceland, Latvia, Luxembourg, Italy, and Germany. Poland, Denmark, and Hungary were the only three countries that saw increases to global growth estimates. Start a two-week free trial to Bespoke Institutional to read more on international economies and the global macro backdrop.
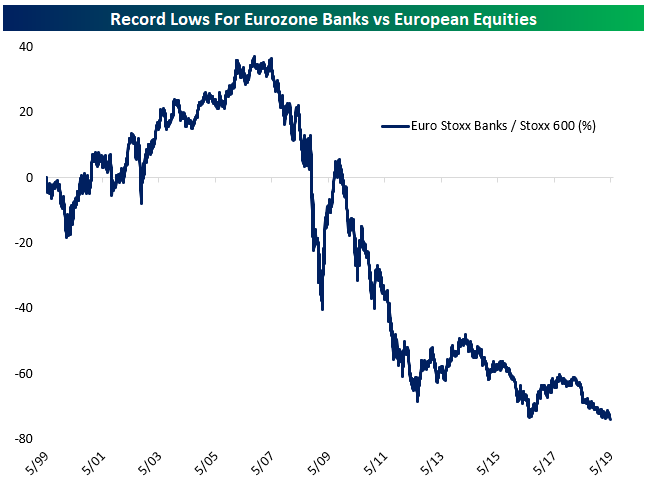
Eurozone Banks Make New Lows Versus The Market
Today Eurozone banks are lagging the market, but that’s nothing new. During the mid-2000s banks were the key drivers of European equity market performance, outperforming by almost 40% from mid-1999 through mid-2007. Since, it’s been a seemingly never-ending series of disasters: the global financial crisis, the Eurozone crisis, non-performing loan build-ups, recapitalization, negative interest rates, and more. As a result, Eurozone banks have underperformed the broadest measure of European stock prices by 77% since the 1990s came to a close. How much lower can this ratio go? Buying Eurozone banks here would certainly qualify as “buying low.” Start a two-week free trial to Bespoke Institutional to read more on international equity markets and the global macro backdrop.