
Bespoke’s Global Macro Dashboard — 6/12/19
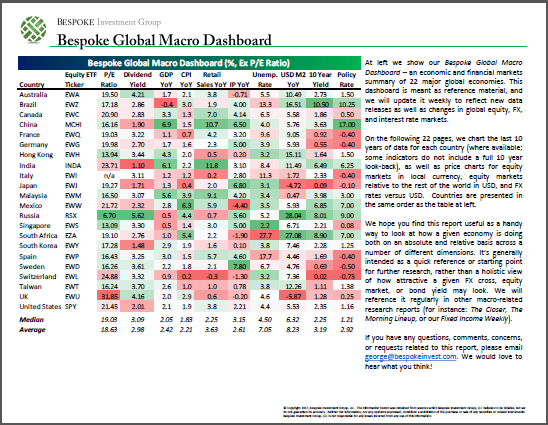
Bespoke’s Global Macro Dashboard is a high-level summary of 22 major economies from around the world. For each country, we provide charts of local equity market prices, relative performance versus global equities, price to earnings ratios, dividend yields, economic growth, unemployment, retail sales and industrial production growth, inflation, money supply, spot FX performance versus the dollar, policy rate, and ten year local government bond yield interest rates. The report is intended as a tool for both reference and idea generation. It’s clients’ first stop for basic background info on how a given economy is performing, and what issues are driving the narrative for that economy. The dashboard helps you get up to speed on and keep track of the basics for the most important economies around the world, informing starting points for further research and risk management. It’s published weekly every Wednesday at the Bespoke Institutional membership level.
You can access our Global Macro Dashboard by starting a 14-day free trial to Bespoke Institutional now!
Morning Lineup – Bounce in Japanese Cap Ex; Beware of Consensus
The ‘pause’ in the rally from yesterday’s early highs is continuing this morning as equity markets around the globe are all trading moderately lower, including the US. Please read today’s Morning Lineup for our latest take on events from overnight and this morning, including the latest on protests in Hong Kong, Credit Growth in China, and some solid economic data from Japan and France.
Bespoke Morning Lineup – 6/12/19

Beware of the consensus. As data and economic models have proliferated throughout the years, investors have increasingly become reliant on them to predict future events. If the ‘market’ or excel model says it’s going to happen, then we are all too ready to take it as a given. A perfect example is the path of Fed policy. With the futures market increasingly pricing in the likelihood that the Fed will cut rates, that’s what everyone now expects. As of this morning, for example, the futures market was pricing in a greater than a three-quarters chance that the FOMC will cut rates between now and the end of July. Three weeks ago, those odds were less than 15%!

So, it’s pretty much guaranteed that the Fed will cut rates and cut them aggressively right? While it’s certainly possible that we may see rate cuts in the months ahead, keep in mind that the consensus often gets it wrong and sometimes incredibly wrong. A perfect example is the 10-year US Treasury yield. The chart below is from a Wall Street Journal article earlier this week and shows how when it came to the direction of long term interest rates in 2019, the consensus couldn’t have been more wrong.
The chart shows the path of the 10-year yield so far in 2019 compared to various forecasts from Wall Street and the economic community. At the end of 2018, not a single economist expected the 10-year yield to be below 2.5% and the average forecast was closer to 3.0%. Right now, the 10-year yield is under 2.12%!

Start a two-week free trial to Bespoke Premium to see today’s full Morning Lineup report. You’ll receive it in your inbox each morning an hour before the open to get your trading day started.
The Closer – Outside Day Reversal, Credit Review, PPI, Distribution of Wealth – 6/11/19
Log-in here if you’re a member with access to the Closer.
Looking for deeper insight on markets? In tonight’s Closer sent to Bespoke Institutional clients, the S&P 500 had a bearish technical pattern today with an outside day reversal, but we show why this may not be that negative of a signal. We also review credit markets and the VIX curve holding firm. Turning to macroeconomic data, we review the PPI report released by the BLS today showing weaker goods inflation and more solid services inflation. We finish tonight with a look at Federal Reserve data on the distribution of wealth in the US. We use this data to show how these different wealth segments allocate their assets.
See today’s post-market Closer and everything else Bespoke publishes by starting a 14-day free trial to Bespoke Institutional today!
Best Starts to June, Any Month
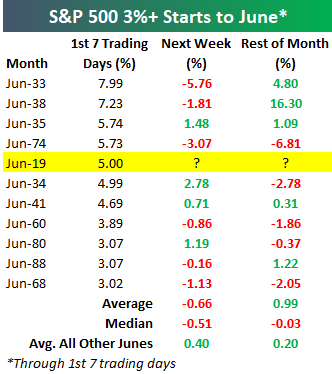
As of mid-day, the S&P 500 was up 5% month-to-date. Below is a look at the best starts to June through seven trading days for the S&P since the index’s inception in 1928. As shown, this ranks as the fifth best start to June on record, and it’s the S&P 500’s best start to June since 1974 when it was up 5.73% through the month’s first seven trading days.
As far as what to expect going forward based on historical seasonality, in the week following all 3%+ starts to June through seven trading days, the S&P has averaged a decline of 0.66% over the next week. And while the index has averaged a gain of 0.99% for the remainder of June following 3%+ gains through seven trading days, the median rest-of-month change is actually negative at -0.03%. This is due to the outlier gain of 16.3% for the remainder of June 1938 after a gain of 7.23% over that month’s first seven trading days.
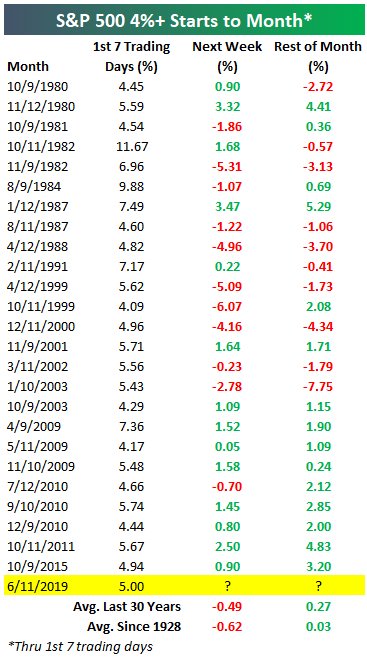
While we’ve seen the 5th best start to June on record, this is also the best start to any month through seven trading days since October 2011 when the S&P rallied 5.67%. Below we show all 4%+ starts to a month through seven trading days since 1980. The most notable takeaway from this data in our view is that the last nine times we’ve seen the S&P gain 4%+ in a month’s first seven trading days, the index has been up over the next week 8 out of 9 times, and it has been up 9 out of 9 times for the remainder of the month. To access our most actionable market research, start a two-week free trial to Bespoke Institutional.
H&R Block’s (HRB) Mixed Triple Play
Popular tax specialist H&R Block (HRB) reported earnings before the market open with solid results. HRB reported a triple play, raising guidance and beating EPS estimates by 14 cents. If there’s ever a quarter where HRB should beat estimates, it’s this one as it’s also the only quarter of the year where the company typically reports a profit. Revenues also came in above estimates by $16.79 million but were down 2.5% YoY. Additionally, the company announced the acquisition of Wave Financial, a Canadian company providing financial software for small businesses. The stock has been fairly volatile in response to these earnings as it briefly traded 2% lower in the pre-market but since the open has been much stronger. As of this writing, HRB is up 2.45%. While well off of the pre-market low, it is also 4.75% off of its intraday’s high of $29.29. Despite this wide intraday range, the stock is currently sitting at the upper end of the past month’s range with the next resistance level to watch being the December 2018 highs right above $28.
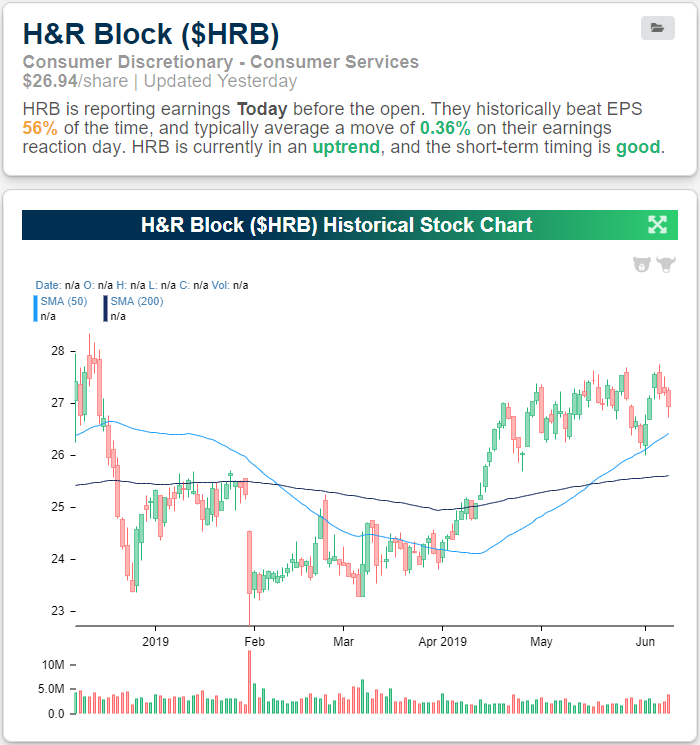
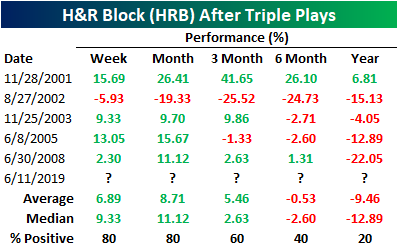
HRB has typically not been the best stock on earnings as the company has only beaten estimates for EPS and sales 56% and 50% of the time, respectively. This quarter’s raised guidance is also a bit unusual for the stock. In the past twenty years, HRB has only seen five other quarters with raised guidance (each one was also a triple play) with the last one occurring over a decade ago in the Q2 2008 report. The quarter following each of these triple plays has usually seen solid performance with 2002 being the only year that HRB saw significant weakness in the quarter following its triple play. On the other hand, six months to a year after a triple play has been a weaker period for HRB. The stock has averaged a decline for both periods and was only positive once a year after its triple play. Our Earnings Explorer is just one of many interactive tools we offer that allow clients to perform analysis like this one on HRB. To access these tools, start a two-week free trial to Bespoke Institutional.
Small Business Sentiment Surprises to the Upside
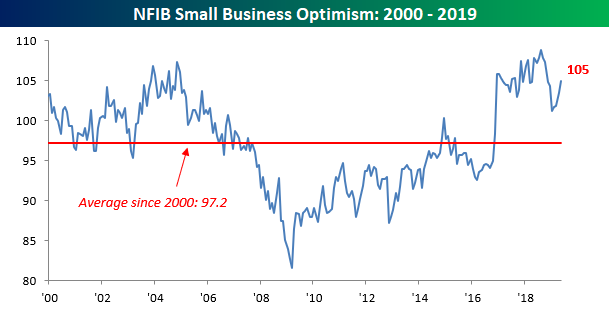
Small business sentiment saw a big upside surprise for the month of May. While economists were expecting the headline NFIB Small Business Sentiment Index to fall to 102.0 from last month’s reading of 103.5, the actual reading went the other way, rising to 105. That makes it four straight monthly gains after five straight months of losses from last August’s record high of 108.8.
As we do each month, we wanted to highlight which issues are currently the biggest problems for small businesses. Leading the way once again this month, Quality of Labor is the biggest problem for businesses, impacting a quarter of all those surveyed. Behind Labor Quality, Taxes and Government Red Tape take up the number two and three spots, but both are well off their historical highs and Red Tape is now only cited by 12% of small businesses as their most important problem. That’s tied for the lowest reading since 2010!
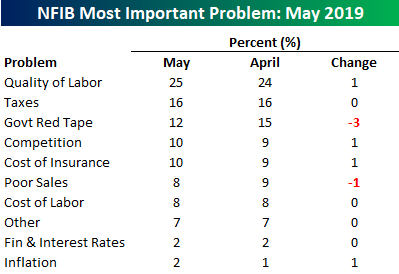
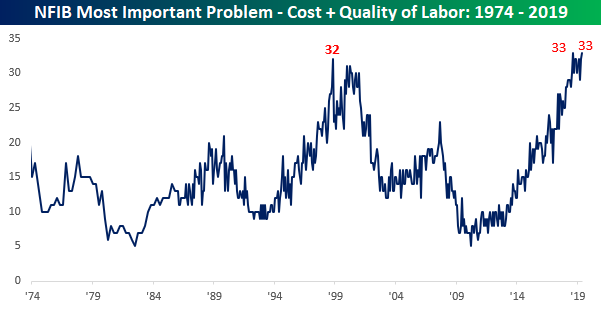
Along with Labor Quality, which was cited by 25% of all small business owners, another 8% cited the Cost of Labor as their most important problem. In other words, on a combined basis, labor issues are the biggest problems for one-third of all small business owners! In the history of the survey, there has only been one other month where the combined reading was as high as it is now (August 2018) and only a handful of other periods where it was above 30 (1998 – 2000 and since the second half of 2018). We just published a report looking at an interesting trend from this month’s NFIB Small Business Sentiment survey and what it means for the market going forward. To access the report, start a two-week free trial to any one of our three membership levels.
Trend Analyzer – 6/11/19 – Back Above the 50-Day
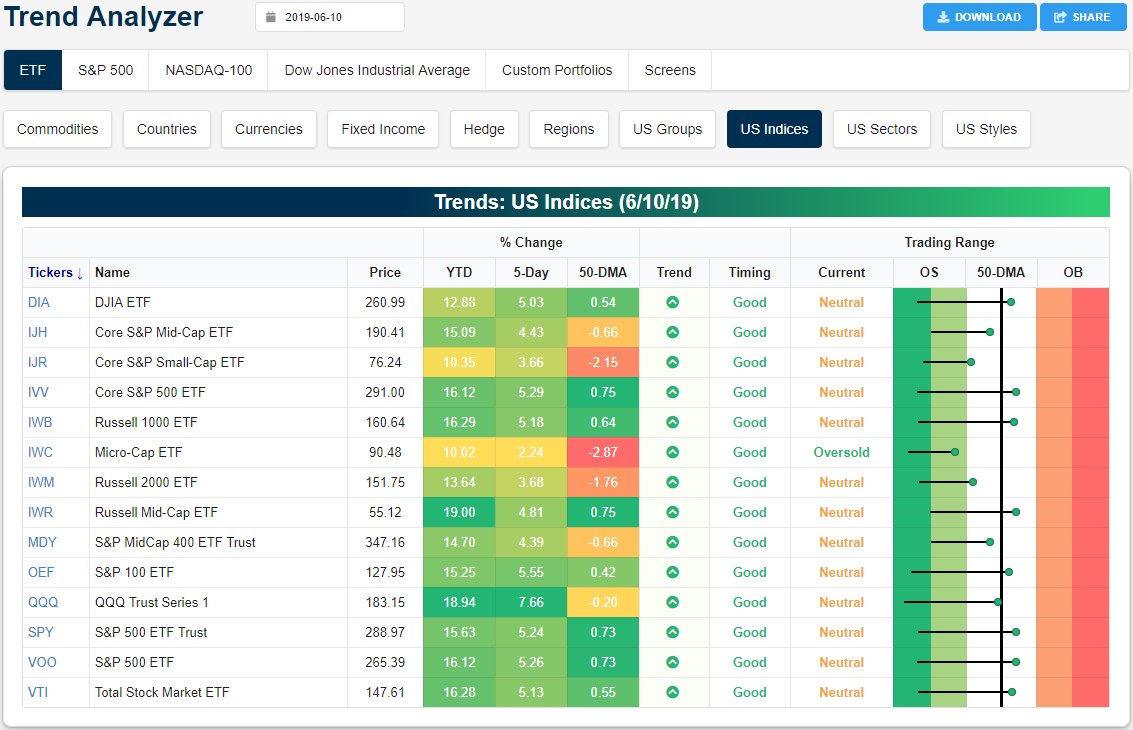
Equities are looking to keep the streak of gains going today which over the past week has brought all of the major index ETFs—except for the Micro-Cap ETF (IWC)—out of extremely oversold territory and into neutral. As shown in the Trading Range section of our Trend Analyzer tool, the long tails to the left indicate the rapid moves from oversold levels for all of these indices. The move has been strong enough to lift more than half of the ETFs above their 50-DMAs. Large caps especially have moved the highest above this moving average. Small-caps, on the other hand, have continued to lag the rest of the market. The aforementioned IWC has seen the smallest gains of only 2.24% in the past week and is still 2.87% below its 50-DMA. Conversely, the Nasdaq (QQQ) has rocketed the most, rising 7.66% in the past five days. And still, QQQ remains under the 50-day!
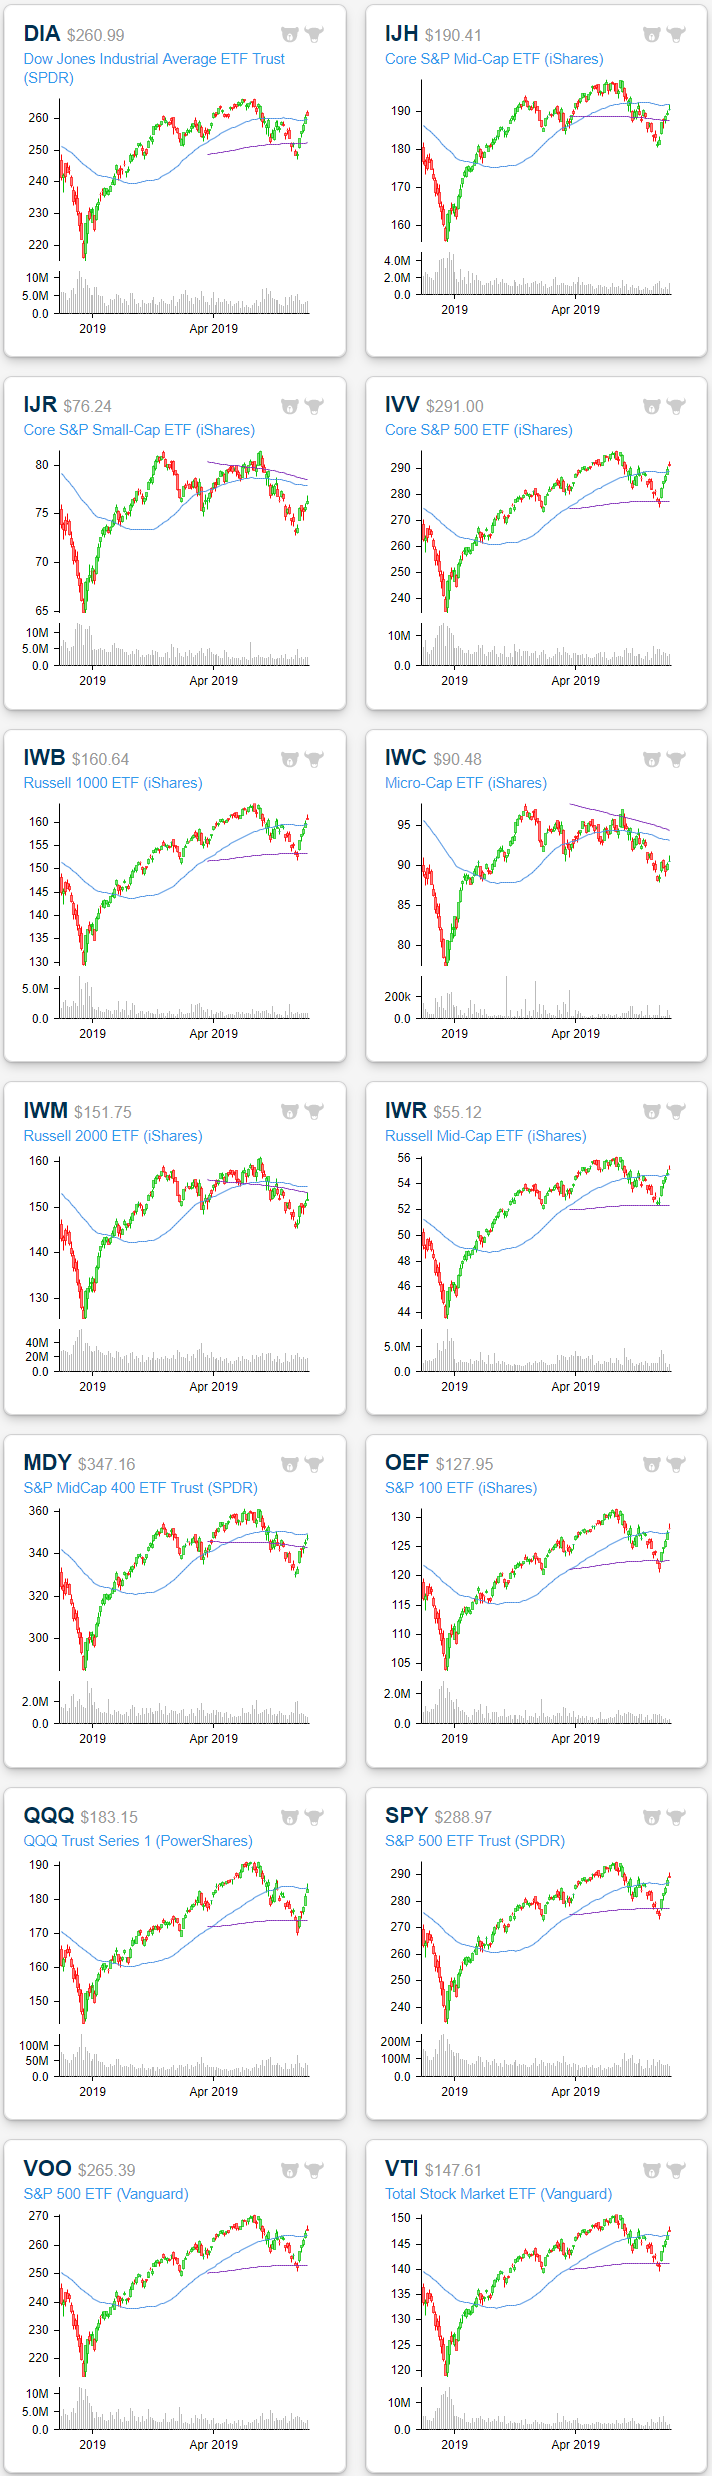
Looking at the charts of the these ETFs, while they have mostly broken through resistance at the moving averages, yesterday’s session did show signs of exhaustion as they sold off from the intraday highs as some like the Dow (DIA) or Core S&P 500 (IVV) even continued to fall below the opening price (resembling the shooting star pattern). While this may be a bit of a sign of hesitation in the current rally, these ETFs have also recently broken out of their short term downtrends. In other words, the technical picture of the major indices has improved even if the rip higher from the past week takes a breather. Start a two-week free trial to Bespoke Institutional to access our interactive Trend Analyzer, Chart Scanner, and much more.
Construction Openings Surge
Yesterday, the BLS released its April Job Openings and Labor Turnover Survey (JOLTS). The JOLTS report allows for a deeper look at the labor market beyond the plethora of statistics included with the monthly Employment Situation Report (which is best known for its Non-Farm Payrolls number). Overall, the JOLTS report showed robust openings levels, cycle highs for quit rates, strong gross hiring, and very slow layoff rates — a generally positive set of indicators for the US labor market.
The most interesting data point in the survey came from job openings at the industry level. Opening levels in the construction industry surged 11% MoM and 40% in two months to a record level. Typically, openings levels are a leading indicator for employment numbers in the construction industry, as shown in the first chart below. The uptick in openings could represent a pending surge in construction hiring (and therefore, activity).
On the other hand, construction openings haven’t consistently led residential construction activity (as measured by housing starts — 2nd chart below), proving a lagging indicator during the last cycle and a coincident one for most of this one.
The same is true for construction spending numbers, which captures residential spending correlated to starts and the nonresidential sector. The surge in construction openings actually looks a bit like the mid-2000s, with modest declines in spending off peak levels taking place as openings continue to surge. While the recent explosion in openings is interesting, it’s hard to be sure whether it’s a positive or negative sign for the construction industry. Start a two-week free trial to Bespoke Institutional to access our interactive economic indicators monitor and much more.

Morning Lineup – Small Business Sentiment Back on Track
After five straight months of declines from an all-time high back in August, it appears as though small business sentiment has gotten back on track. This morning’s release of the NFIB Index of Small Business Sentiment showed a larger than expected increase as the headline index came in at a level of 105.0 compared to estimates for a reading of 102.0. While the index is still off its record high of 108.8 from last August, it has risen for four straight months now, which is tied for the longest streak of increases since the four months that followed the 2016 election.
In other news, foreign equity markets are in rally mode once again despite relatively weak economic readings. In the US, PPI will be released shortly, but as the President already tweeted, “The United States has VERY LOW INFLATION, a beautiful thing!” Please read today’s Morning Lineup for our latest take on events from overnight and this morning.
As markets have started to recover, the yield curve is still inverted (as it has been for the last three weeks), but it has become less so over the last six trading days. As shown in the chart below, the curve has steepened from a low of negative 25 bps on June 3rd to 9 bps this morning. That’s the largest six-day steepening since October.

Start a two-week free trial to Bespoke Premium to see today’s full Morning Lineup report. You’ll receive it in your inbox each morning an hour before the open to get your trading day started.
The Closer – Fed Pricing, JOLTS – 6/10/19
Log-in here if you’re a member with access to the Closer.
Looking for deeper insight on markets? In tonight’s Closer sent to Bespoke Institutional clients, we show what the two year Treasury note is pricing in terms of the policy rate over the next two years and how this plays into multiple scenarios. We also look at how equities performed the last time markets were pricing in cuts this aggressively. We then look at this morning’s JOLTS report which still showed strong demand for labor.
See today’s post-market Closer and everything else Bespoke publishes by starting a 14-day free trial to Bespoke Institutional today!