The Closer: End of Week Charts — 7/19/19
Looking for deeper insight on global markets and economics? In tonight’s Closer sent to Bespoke clients, we recap weekly price action in major asset classes, update economic surprise index data for major economies, chart the weekly Commitment of Traders report from the CFTC, and provide our normal nightly update on ETF performance, volume and price movers, and the Bespoke Market Timing Model. We also take a look at the trend in various developed market FX markets.
The Closer is one of our most popular reports, and you can sign up for a free trial below to see it!
See tonight’s Closer by starting a two-week free trial to Bespoke Institutional now!
Record Outflows From Equity Mutual Funds
Earlier this week the Investment Company Institute (ICI) released weekly mutual fund flows for the week ending July 10th. Every single category of equity fund flows had outflows this week, which is relatively rare; of the 654 weeks with data since 2007, only 70 have seen that kind of consistency across all equity categories…and four of those have been in the past four weeks! Total equity fund outflows were $46bn this week, versus $6.8bn for the week and $85.4bn over the past three months. On a cumulative basis, $1.2trn has left equity mutual funds since January of 2007. Start a two-week free trial to Bespoke Institutional to access our interactive economic indicators monitor and much more.

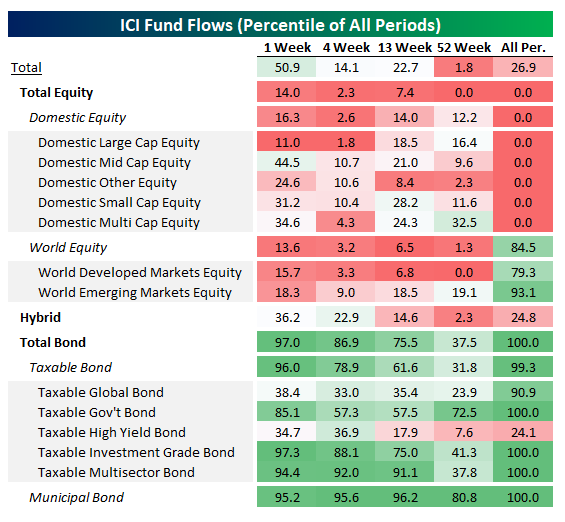
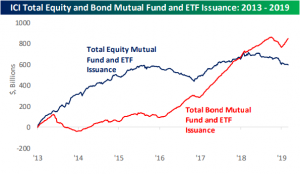
With equity fund flows in the bottom quintile of all periods in recent weeks, bond funds have been the complete opposite story. As shown in the table below, bond fund inflows were in the 97th percentile overall this week and in the 94th percentile or higher in four different categories. The only areas that were at all weak were taxable global bonds and high yield bonds. On a cumulative basis, bond fund inflows total $1.7trn since the start of 2007, an interesting mirror image of the $1.7trn in domestic equity fund outflows since 2007.
The bottom line is that equity fund flows have been very large over the past year. As shown in the chart below, more than $320bn has flowed out of equity funds over the past year, more than any other 52-week period in the history of the day. Even at the height of the crisis, investors were pulling substantially less from funds.
B.I.G. Tips – Yield Curve Un-Inverts
Yesterday, the yield curve (spread between yields on 10-year and 3-month US Treasuries) briefly moved into positive territory for the first time since May 23rd and ended a streak of 40 days at inverted levels. While the curve barely moved out of inverted territory (less than one basis point) and is in and out of inversion this morning, positive is positive! As we have mentioned in the past, while it has been a reliable recessionary indicator (sometimes with a lag), an inverted yield curve does not necessarily mean things will immediately turn south for the stock market.
To continue reading this B.I.G. Tips report, start a two-week free trial to Bespoke Premium.
Trend Analyzer – 7/19/19 – Precious Metals Soar
The Dow (DIA) has distanced itself from the other major index ETFs in the past week. While other large-cap ETFs like the S&P 100 (OEF) have dropped 0.23% and the Nasdaq (QQQ) is flat, DIA has managed to rise 0.5%. DIA is also the most overbought of all the major index ETFs, although like other large caps, it is less overbought than it was one week ago. On the other hand, mid-caps like the S&P MidCap 400 (MDY) and the Russell Mid-Cap (IJR) have actually moved higher within their trading ranges on small gains. At their current levels, the S&P MidCap 400 (MDY) and the Core S&P Mid-Cap (IJH) both have good timing scores in our Trend Analyzer.

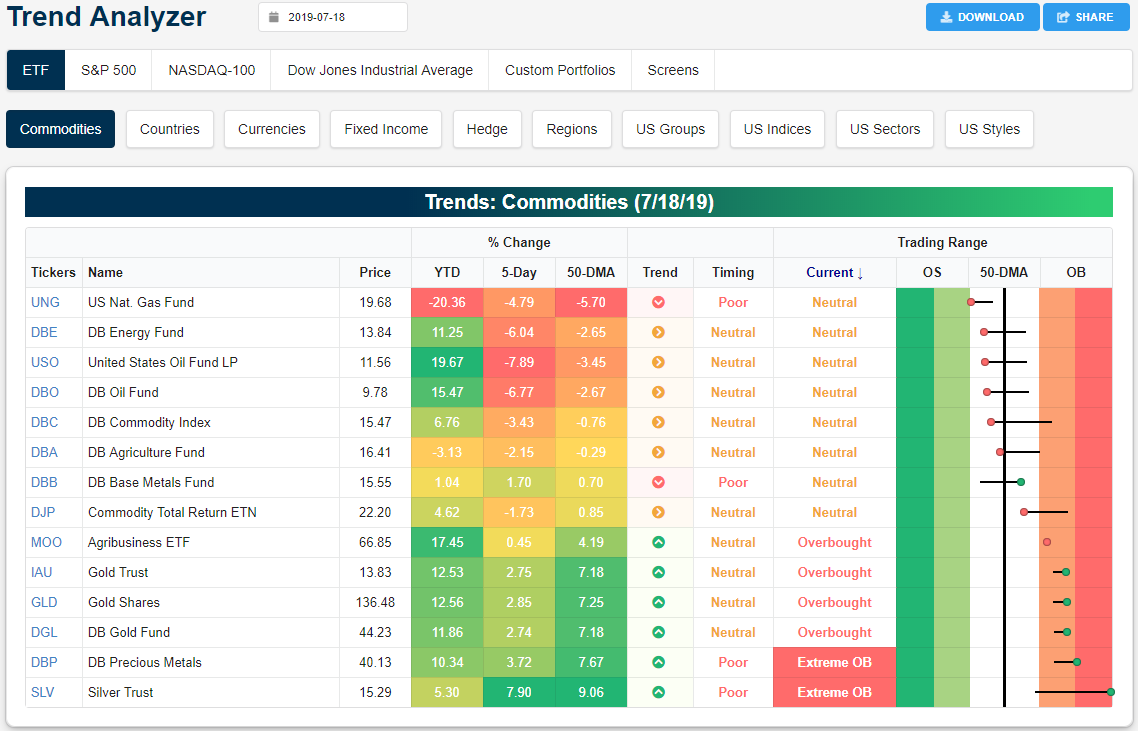
Equity indices have not managed to see any sort of large move in the past week as each of the fourteen has gained or lost less than 1%. Meanwhile, the commodities space has been much more volatile. In particular, oil (USO) and energy in turn as seen through the DB Energy Fund (DBE) have gotten smashed over the past week. USO is down 7.89%, falling below the 50-DMA and moving towards oversold levels. Similarly, Nat. Gas (UNG) continues this year’s pain falling 4.79% further.
Contrary to the moves in energy markets, precious metals like silver (SLV) have been soaring. After lagging behind gold recently, the Silver Trust (SLV) has finally caught up with the yellow metal. SLV has risen 7.9% over the past week, the best gain of any commodity. Ironically, earlier in the week it was actually negative YTD but these gains over the past five days have brought it to a 5.3% YTD gain. But also with this surge, SLV is now extremely overbought sitting over 2 standard deviations above the 50-DMA. Gold ETFs on the other hand, while not seeing as large of a move, has also done well rising around 2.75%. Precious metals in general as seen through DB Precious Metals (DBP) have become extremely overbought.
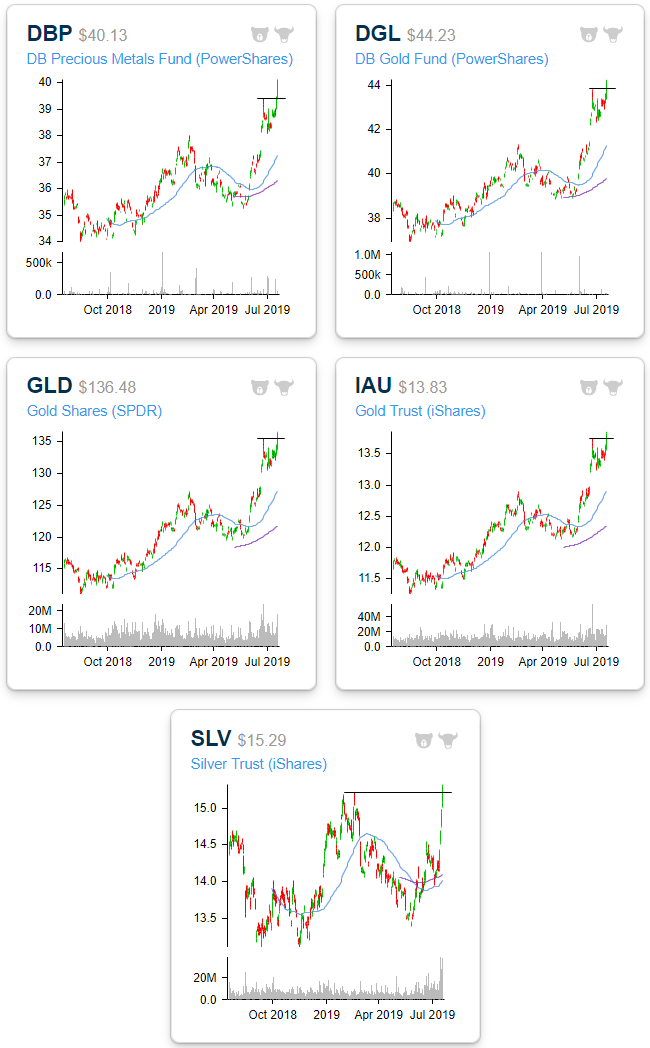
Looking at the charts, yesterday’s strong session for precious metals led to a further breakout to 52-week highs across the board. While the DB Precious Metal Fund (DBP) and gold’s break out is above more recent resistance, silver’s 52-week high took out resistance from much earlier in the year. In reaching this new high, SLV’s chart makes it pretty evident as to just how rapid the move has been and the degree to which it is extended to the upside.
Bespoke’s Morning Lineup – Tech Back in Charge
After yesterday’s somewhat strange combination of positive economic data and dovish FOMC commentary, futures are showing continued positive momentum with equities indicating a modestly higher open led by the Nasdaq and Microsoft’s (MSFT) earnings after the close Thursday. The stock is currently up over 3%, further cementing its place in the trillion market cap camp. Treasury yields are modestly higher at the long end of the curve, and the 10-year vs 3-month curve is close to positive territory.
Read today’s Morning Lineup to get caught up on news and stock-specific events ahead of the trading day and a further discussion of recent earnings reports from around the world.
Bespoke Morning Lineup – 7/19/19

Each Thursday in our Sector Snapshots report, we highlight the relative strength of individual sectors versus the S&P 500. One sector that stood out in last night’s update was Technology. While the sector has been a market leader for some time, it has finally erased all of its underperformance from the month of May and is the only sector where relative strength is at a new high.

One contributor to the sector’s strength recently is semiconductors. From its highs in April to the May lows, the Philadelphia Semiconductor Index (SOX) nearly reached bear market territory on an intraday basis falling 19.8%. Since then, the SOX has rallied 18.9%, and while it is still shy of new highs for the year, it did close on Thursday at its highest level since 5/6.

Start a two-week free trial to Bespoke Premium to see today’s full Morning Lineup report. You’ll receive it in your inbox each morning an hour before the open to get your trading day started.
“We Don’t Need Your Stinking Data”
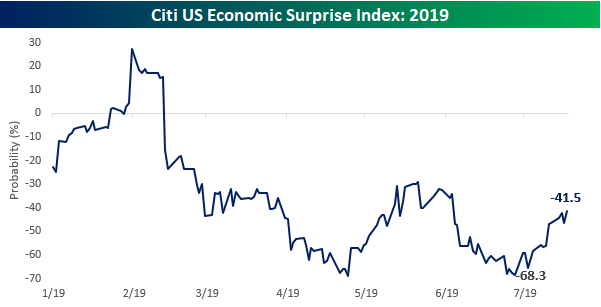
Yesterday was another one of those days that makes you scratch your head. In a relatively busy day for economic data, Initial Jobless Claims came in within 25K of a 50-year low, and the Philly Fed Manufacturing report saw its largest m/m increase in a decade. That follows other data last week where Retail Sales were very strong and CPI and PPI both came in ahead of consensus forecasts. The trend of better than expected data since the June employment report on July 5th is reflected in recent moves of the Citi Economic Surprise Index which has rallied from -68.3 up to -41.5. Granted, it’s still negative, but what was looking like a real dismal backdrop for the economy just three weeks ago seems to be showing signs of improvement.
On top of the economic data, two notable interviews from FOMC officials Williams from New York and Vice Chair Clarida moved markets. Given the strong tone of economic data, one would expect both officials to try and tone down rising market expectations regarding any aggressive policy moves at the July meeting. Well, markets don’t always make sense.
In their respective interviews, both Williams and Clarida not only didn’t tone down expectations, but they added fuel to the fire. Williams noted that “it pays to act quickly to lower rates” and “vaccinate” the economy “against further ills.” Clarida was even more direct when he said that “Research shows you act preemptively when you can.” In other words, the data-dependent Fed is casting the data aside and ready to move anyway. In his interview on Fox Business, Clarida almost got a chuckle when asked whether there was any chance the Fed wouldn’t cut rates in July.
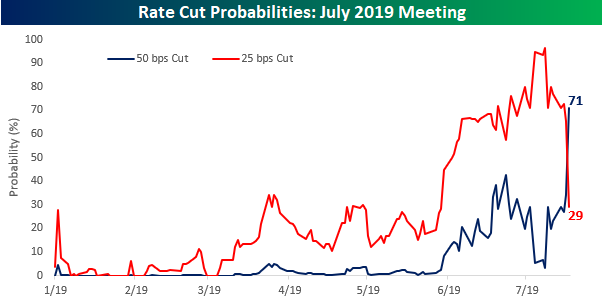
The dovish turn from the Fed was immediately reflected in market expectations for rate policy at the July meeting. Back in June, market expectations for a 50 basis points (bps) cut at the next meeting peaked out at under 50%. Then, in the days following the June employment report, expectations dropped all the way down to 3%. In the last ten days, though, the trend has completely reversed, and as of yesterday’s close topped out at 71% versus just a 29% chance for a 25 bps cut. Probabilities for a 50 bps cut came in a bit overnight but are still at about 50/50. Yesterday alone, though, expectations for a 25 bps cut and a 50 bps cut more than completely reversed from the prior day, and remember, that’s after what was a good day of economic data! Can you imagine what expectations would be like if the data was actually bad? Become a Bespoke Premium member today with a two-week free trial.
The Closer – Consumer Cruising, Silver Flying, Leading Index, Five Fed – 7/18/19
Log-in here if you’re a member with access to the Closer.
Looking for deeper insight on markets? In tonight’s Closer sent to Bespoke Institutional clients, in the face of more talks of rate cuts by Fed officials today, we show the strength of the consumer in addition to the strength of silver in recent trading. Next, we look at the only notably weak data point released today: the leading index. After today’s strong Philly Fed Manufacturing Activity Index, we provide an update to our Five Fed Manufacturing Composite.
See today’s post-market Closer and everything else Bespoke publishes by starting a 14-day free trial to Bespoke Institutional today!
5G Leads to First Triple Plays of Earnings Season
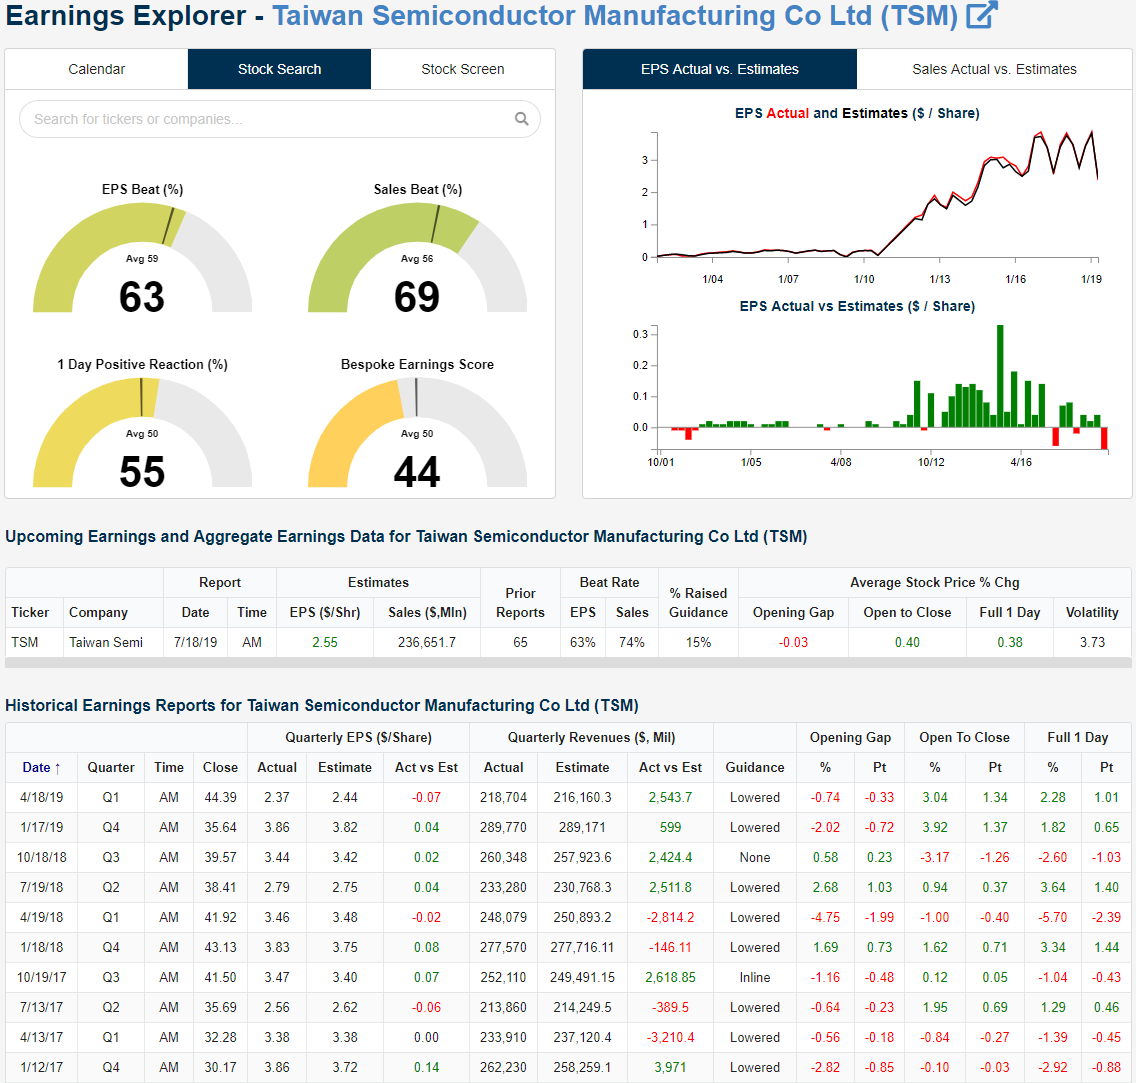
The past 24 hours have seen the first Triple Plays of earnings season from Taiwan Semiconductor Manufacturing (TSM) and Crown Castle (CCI). Both companies reported strong quarters, and the common theme between the two was 5G.
TSM reported before the opening bell with a 2 cent EPS beat and the company’s widest beat in revenues since October of 2016. Revenues were also up 3.3% from last year’s Q2 report which the company credited to stronger demand across the board. TSM highlighted their high-performance computing (HPC) and smartphone segments as the top growth areas thanks to accelerated 5G implementation. This triple play was a pleasant change of pace for TSM seeing as the company lowered guidance in eight of its last ten quarters. Midday, the stock is up just over 3.4% which isn’t far off from the average 3.73% move the stock sees following its past earnings reports.
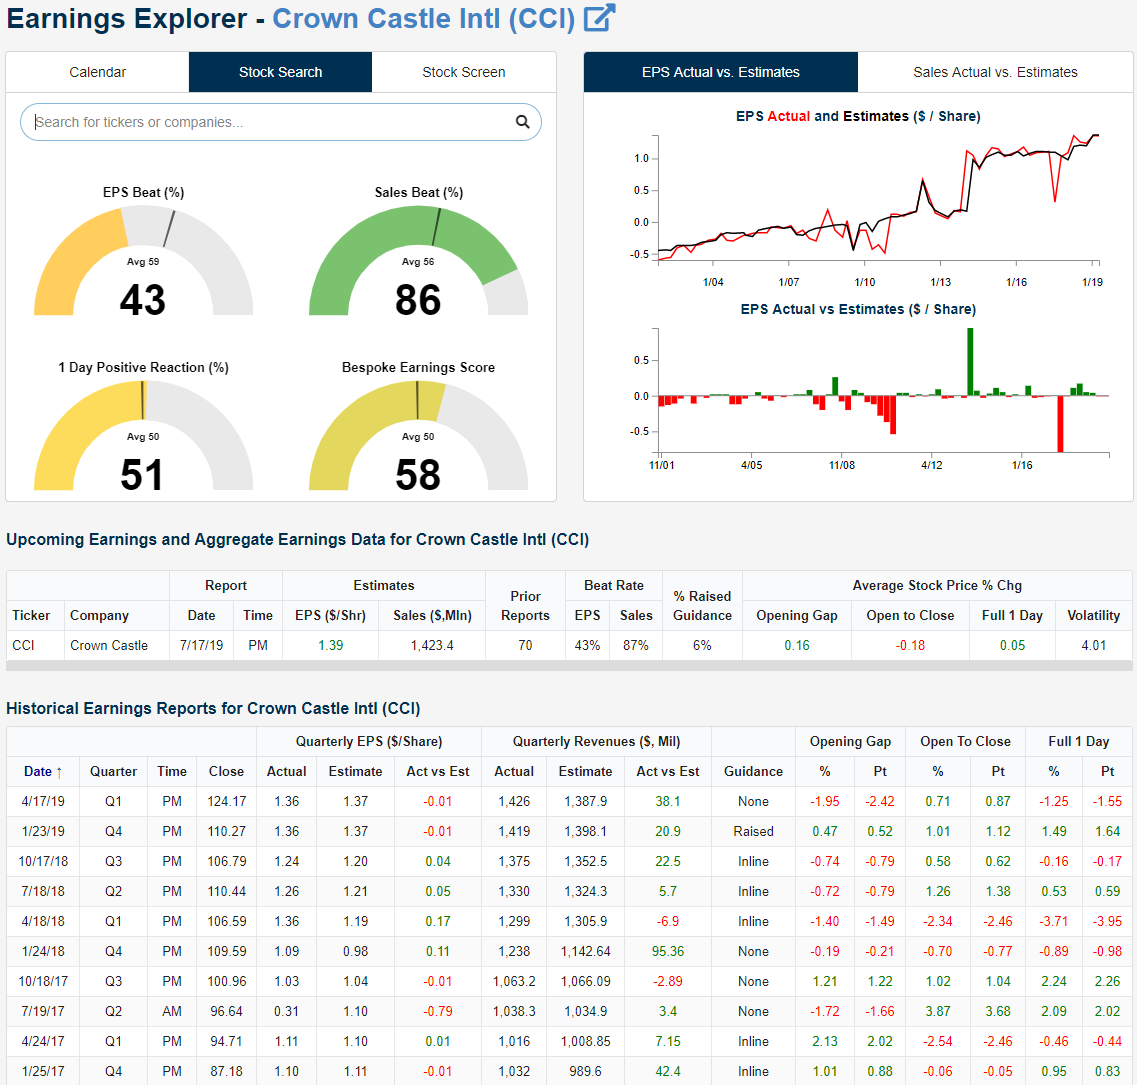
Crown Castle (CCI) is one of the major cell-tower plays in the US. Reporting after the close yesterday, the company reported EPS of $1.44, 5 cents above estimates. Revenues grew 11% year-over-year, beating analyst forecasts by almost $55 million. This was the first triple play for CCI since its January 2015 report.
As with TSM, CCI’s business is obviously highly intertwined with the broader trend of growth in smartphone usage. As such, the still early but accelerating growth of 5G implementation in addition to the continued growth of the 4G network helped to bolster the quarter’s results. Despite this, the stock has traded lower in reaction, falling over 4% intraday. The last time the stock responded this poorly to earnings was in October of 2014 when it fell 6.15%. One potential reason behind the negative reaction is the company forecasted deployment of small cells, which is a way of implementing 5G, to be at the lower end of the prior guidance range due to slowdowns in construction timelines. Granted, this is somewhat of a high-quality problem as the company reported the slowdown essentially being a result of strong demand. In its results, CCI stated the increased construction timeline was caused by a “significant increase in small cell deployments [which] is straining the response time of municipalities and utilities.”
AAII Just Fine As Investors Intelligence Gets Extended
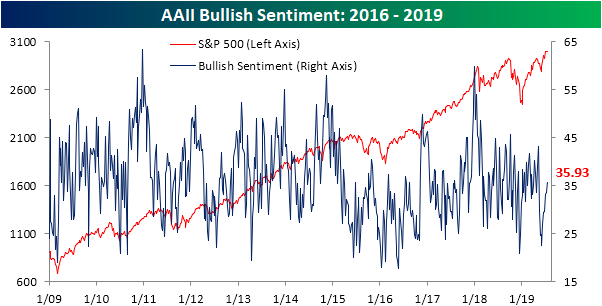
In the weekly AAII investor survey, bullish sentiment is the predominant sentiment reading for the first time since early May. Rising for the sixth week in a row, bullish sentiment now rests at 35.93%; the highest since May 9th when it was 43.12%. Bullish sentiment has slowly recovered following May’s retracement even as the major indices reached new all-time highs. Given this, bullish sentiment is still within a normal range and by no means is overly extended. At 35.93%, it remains below the historical average of 38.16% as it has for ten straight weeks now. That is the longest such streak of below-average readings since a 12-week streak ending in May of last year.
While bullish sentiment has remained relatively muted as measured by AAII, another sentiment survey run by Investors Intelligence has been running pretty hot leading to a pretty mixed overall picture based sentiment. In the past two week’s Investor Intelligence’s percentage of investors reporting bullish sentiment has risen up to 58% which is over one standard deviation above the historical average. As with AAII, this is negative from a contrarian perspective, as more extremely high readings have preceded significant market downturns. Granted, it was notably higher ahead of the past two downturns in 2018. Ahead of the January 2018 and Q4 2018 sell-offs, bullish sentiment by this measure topped 60%. In other words, while this is extended and something to watch, it isn’t necessarily sounding the alarm for worry yet, especially given the divergence from AAII.

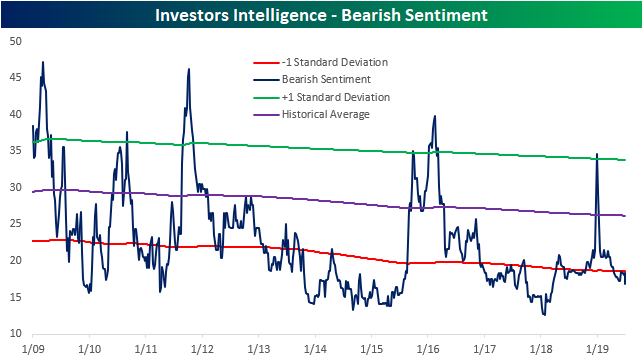
Similarly, Investors Intelligence’s bearish sentiment reading remains a bit extended to the downside as it has for the past 12 weeks. At 16.8%, it is the lowest in over a year (since March 21st, 2018).
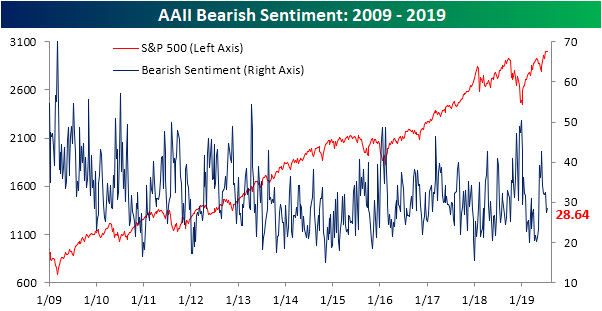
On the contrary, AAII’s reading on bearish sentiment actually saw a slight increase to 28.64% from 27.5% last week. As with AAII’s bullish sentiment, bearish sentiment is not extended to the up or downside and also sits below the historical average of just over 30%.
Bulls and bears borrowed from neutral sentiment this week as the percentage of investors reporting as neutral fell to 35.43%. While that is down off of readings above 38% that were observed through most of the past two months, neutral sentiment remains in a range from the mid to high 30’s as it has most of 2019. That is above the historical average of 31.52%. Start a two-week free trial to Bespoke Institutional to access our interactive economic indicators monitor and much more.

Claims Back Up But Still Low
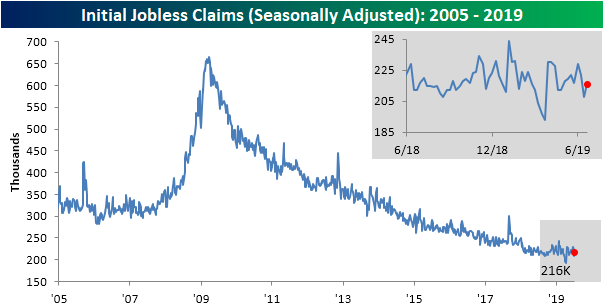
Last week, the Department of Labor’s weekly Initial Jobless Claims came in at 209k, which was the lowest level since April’s multi-decade low print of 193K. This week, that 209K was revised even lower to 208K while this week’s data met expectations by rising to 216K. This leaves claims still at the lower end of the past year’s range. Seasonally adjusted claims have been at or below 300K for 228 weeks and at or below 250K for 93 weeks.
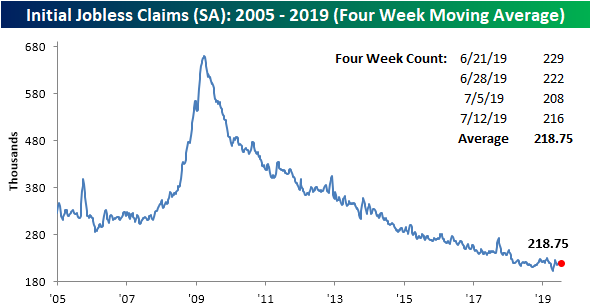
The four-week moving average for seasonally adjusted claims saw only a slight change falling from 219K down to 218.75K. This is as mid-June’s print of 217K rolled off the average to be replaced by this week’s 216K. This was the smallest absolute change in the moving average of 2019 and the smallest move since a 0.25K increase in October of last year.
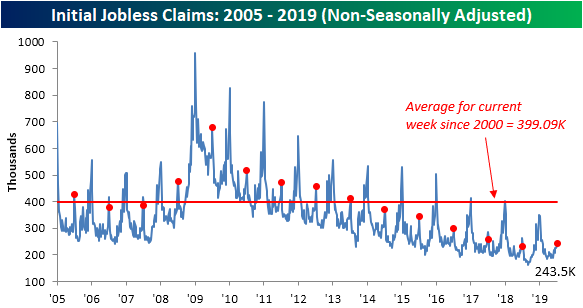
On a non-seasonally adjusted basis, as could be expected due to seasonal factors, claims rose to 243.5K from 232K last week. A week over week increase is common for this time of the year. As shown from the red dots in the chart below, this week of the year has frequently marked a short term peak for non-seasonally adjusted claims throughout the current cycle. Granted, more recently in 2017 and 2018, that peak was actually the previous week of the year. Given this, this week’s NSA data saw a year-over-year increase but the 243.5K was still below the 2018 seasonal peak of 264.9K. In other words, the YoY increase can be taken with a grain of salt. Start a two-week free trial to Bespoke Institutional to access our interactive economic indicators monitor and much more.