S&P 500 Drawdowns From Record Highs
With US equities down another 10% today, the S&P 500 is moving increasingly closer to reaching the threshold of a 30% decline. As of this afternoon, the S&P 500 is down 26.7% from its record high less than one month ago. The chart below shows S&P 500 drawdowns from record closing highs since the start of 2000. The last twenty years have really been a period to behold for US equities. Even though it includes one of the longest bull markets in history, the S&P 500 has seen drawdowns of 49.1%, 56.8%, and now 26.9%. Start a two-week free trial to Bespoke Institutional to access our full suite of research and interactive tools.

Fall of the Empire
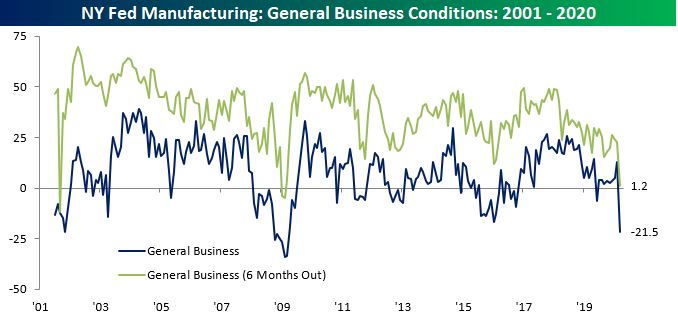
One of the first big drops in US economic data showed its face today in the form of the first of the regional Fed indices covering the month of March. The NY Fed’s headline reading on general business conditions experienced it largest drop on record in March, falling 34.4 points from 12.9 in February to -21.5. That is the first negative reading since June of last year, but the lowest level of the index for current conditions since March of 2009 during the financial crisis. Back then, the index remained below -20 for six consecutive months. Prior to then, the only similar readings can be found early in the survey’s history in November of 2001.
As for expectations six months out, this month’s reading of 1.2 is again the lowest reading since early 2009, and as with the current conditions index, you would need to go back to 2001 to find similarly low readings before that. The 21.7 point decline in expectations this month is also the largest one month decline since January 2009 when it dropped by slightly more (24.9 points). Overall, New York area businesses’ outlook in both the near term and further out have deteriorated dramatically in just one month.
Of the individual components, pretty much everything was weaker this month for both current conditions and expectations. Only two categories (expectations for unfilled orders and inventories) rose this month. Other than the headline index, the two categories who’s declines stand out the most, and likely drove the large declines for the headline number, are for new orders and shipments. While other categories’ declines are much more modest by comparison, they too are significant nonetheless.

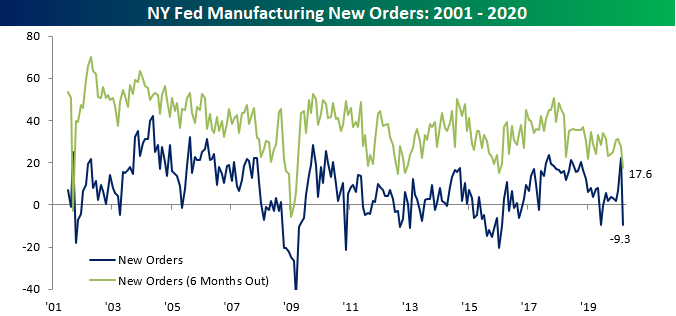
The index for new orders fell from 22.1 last month to -9.3. This was slightly lower in June of last year when it had fallen to -9.7, but the 31.4 point month-over-month decline was the third largest on record behind October of 2001 (43.2 point drop) and November of 2010 (31.8 point drop). With current demand drying up, expectations for the future are also weak as the index for expectations six months out fell to 17.6 from 27.5 in February. While this does not draw parallels to the financial crisis like other aspects of this month’s survey, this is the lowest level since January 2016.
Given the weaker demand, the index for shipments has also come down a lot. The current conditions index for shipments is in negative territory, -1.7, for the first time since October of 2016. The 20.5 point decline from last month is the largest decline since August of 2015. As for the forward looking indicator, conditions have not fallen off of a cliff in the same way, but are at the low end of the past several year’s range. Now at 20.5, it is at its lowest level since only October.

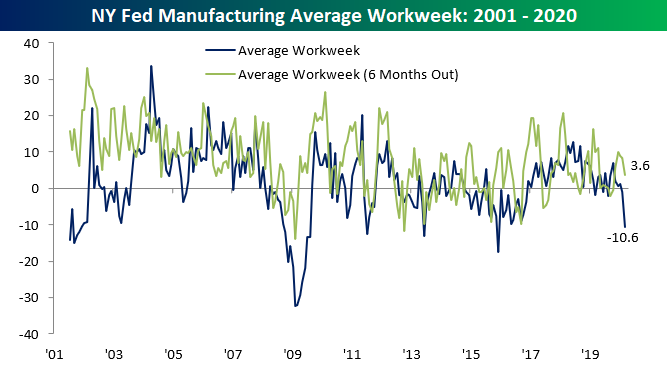
Weekly jobless claims have been one economic indicator that have been closely watched over the past several weeks given their higher frequency and potentially more timely reading on the impacts of Covid-19 on the American workforce. While nothing has shown up there, the NY Fed’s indices for number of employees and average workweek have turned lower. The index for number of employees has been significantly lower multiple times in the past few years making the drop to -1.5 nothing too crazy, but the 8.1 point decline was the largest in over a year. Meanwhile, expectations for increasing the number of workers six months out is at its lowest level since 2017. Not only are NY area businesses not taking on more workers, but the index for average workweek fell to -10.9 which is the lowest level since December 2015. Start a two-week free trial to Bespoke Institutional to access our interactive economic indicators monitor and much more.

Bespoke’s Morning Lineup – 3/16/20 – Off the Charts
See what’s driving market performance around the world in today’s Morning Lineup. Bespoke’s Morning Lineup is the best way to start your trading day. Read it now by starting a two-week free trial to Bespoke Premium. CLICK HERE to learn more and start your free trial.
Despite unprecedented stimulus from the Federal Reserve last night, US and global equity futures are trading limit down while US Equity Index ETFs are trading down roughly 10%. In fixed income markets, which were extremely stressed last week, conditions have shown some signs of not getting any worse, but major problems remain as the US economy and economies of countries around the world have essentially clogged to a halt.
Read today’s Bespoke Morning Lineup for a discussion of all the Fed’s moves, the troubling increases in Covid-19 cases in Europe, and a look at how the FOMC’s actions have impacted credit markets.

The chart below is from page two of today’s Morning Lineup and shows where sectors finished off last week relative to their trading ranges (as measured by standard deviations below their 50-DMA). The circle shows where each sector most recently closed and the tail shows where it closed a week ago. Finally, the boundary for each sector is three standard deviations above or below their 50-day moving average.
Even after Friday’s monster rally in the final minutes of trading all but one sector (Technology) was at least two standard deviations below its 50-DMA. With US equities on pace to open down by roughly 9% today, many of these sectors will likely be going off the charts once again.

Bespoke Brunch Reads: 3/15/20
Welcome to Bespoke Brunch Reads — a linkfest of the favorite things we read over the past week. The links are mostly market related, but there are some other interesting subjects covered as well. We hope you enjoy the food for thought as a supplement to the research we provide you during the week.
While you’re here, join Bespoke Premium for 3 months for just $95 with our 2020 Annual Outlook special offer.
Social Distance Immediately
Cancel Everything by Yascha Mounk (The Atlantic)
A compelling argument that governments and corporations need to immediately reduce human contact that spreads Covid-19 in order to reduce the total number of people who contract the virus. [Link; soft paywall]
The City That Never Sleeps Is Brought to Standstill by Virus by Olivia Rockeman, Katya Kazakina, and Henry Goldman (Bloomberg)
A summary of what sort of massive impact Covid-19 is having on the swirling heart of finance and media for the entire world. [Link; auto-playing video]
Housebound Italian Kids Strain Network With Fortnite Marathon by Daniele Lepido and Niclas Rolander (Bloomberg)
With tens of millions (if not more) people shuttered into their homes across Europe and the rest of the developed world, networks which facilitate streaming and gaming are under increasing strain. [Link]
Coronavirus is mysteriously sparing kids and killing the elderly. Understanding why may help defeat the virus. by William Wan and Joel Achenbach (WaPo)
While a tiny fraction of those under the age of 40 (and an even smaller one under the age of 20) suffer serious cases of Covid-19, the WHP estimates a death rate of over 20% for those above 80. [Link]
Coronavirus case from November could be patient zero by Amanda Woods (New York Post)
The earliest-known coronavirus patient was a 55-year old man in Wuhan during mid-November, one of more than 250 infections from 2019, long before the virus burst on to the scene. [Link]
About Half of Cruise Virus Cases Asymptomatic, Study Suggests by Tim Loh (Bloomberg)
Comprehensive testing regimes for of small populations suggest that a very large fraction of those who have Covid-19 either do not ever or do not yet present symptoms of the disease. [Link; soft paywall]
Two Women Fell Sick From the Coronavirus. One Survived. by Sui-Lee Wee and Vivian Wang (NYT)
The line between easily overcoming Covid-19 and falling victim to the virus is often imperceptible to the naked eye, even among workers who draw huge viral loads from constant exposure to the disease. [Link; soft paywall]
More Coronas
The Dismantled State Takes on a Pandemic by Alex Pareene (The New Republic)
A multi-decade project to strip the federal government of capacity is coming home to roost amidst a bungled and haphazard response to a global pandemic that is now running entirely out of control in the United States. [Link; soft paywall]
Coronavirus burial pits so vast they’re visible from space by Erin Cunningham and Dalton Bennett (WaPo)
With Covid-19 running unchecked throughout Iran, the Shia holy site of Qom has proven ground zero for both cases and deaths, leading to so many bodies that authorities appear to be burying them in mass graves. [Link]
Testing
Gates-funded program will soon offer home-testing kits for new coronavirus by Sandi Doughton (Seattle Times)
As Covid-19 spreads widely, rapid testing has been a focal point of innovation which might allow those with the virus to be able to avoid spreading it; one kit offers at-home testing kits that would not require leaving the house. [Link]
Colorado changes policy for drive-up COVID-19 testing facility by Blair Miller (NBC KOAA)
A drive-through testing facility that makes it possible for Colorado residents to get tested without leaving their vehicles has seen massive demand. [Link]
The Cost of Not Getting Tested For Coronavirus: A $10k ER Bill (The City)
After coming back from Italy, a Brooklyn public school teacher was told she couldn’t be tested for the deadly epidemic but the total cost of her brief ER visit was still five figures. [Link]
Covid-19 Effects
U.S. Recession a Coin Toss as Chances Climb to 53% Within Year by Reade Pickerty, Yue Qiu, and Alexander McIntyre (Bloomberg)
Exploding credit spreads, plunging bond yields, and stock prices 25% below where they sat a few weeks ago; these are just some of the financial market signals that indicate imminent recession. [Link; soft paywall]
Coronavirus will change how we shop, travel and work for years by Enda Curran (MSN)
An exploration of how the current global pandemic might change consumer behavior, from tourism hiring to regulation of cleaning regimes. [Link]
Leaked Emails: Norwegian Pressures Sales Team to Mislead Potential Customers About Coronavirus by Alexi C. Cardona (Miami New Times)
In an effort to prevent cancellations, salespeople from Norwegian Cruise Lines tried to play down the risks Covid-19 posed to guests as the industry teetered on the edge of total free-fall. [Link]
Europe
Germany to offer companies unlimited credit to withstand coronavirus crisis by Jill Petzinger (Yahoo!)
In order to keep companies’ doors open during a catastrophic collapse in demand, the German government is getting ready to grant billions in loans, with no upper limit on the liquidity being deployed. [Link]
‘We Are Like Animals’: Inside Greece’s Secret Site for Migrants by Matina Stevis-Gridneff, Patrick Kingsley, Haley Willis, Sarah Almukhtar and Malachy Browne (NYT)
As finger-pointing and recriminations resound across the Greco-Turkish border (as has been the case for a very long time indeed), migrants are caught in the crossfire…sometimes literally. [Link; paywall]
How We Live Now
A no-savings generation is cashing in its sneaker collections by Ronald D. White (MSN)
As precarity mounts even in the midst of a long economic expansion, consumers are turning to some unusual places to find some cash during times of need. [Link]
Sit, stay forever: Americans willing to pay top dollar to keep old dogs alive by Barbara Goldberg (Reuters)
Americans are investing thousands in health care to prolong the lives of pets that were once regarded as a much less important destination for funds. [Link]
Why 30-50 Feral Hogs Went Viral After Two Mass Tragedies by Casey Johnston (Vice)
An investigation into the virality of a uniquely horrible (but also darkly hilarious) argument against gun control in the wake of multiple mass shootings. [Link]
Malfeasance
SEC Votes to Ease Audit Requirements for Smaller Companies by Paul Kiernan (WSJ)
In a move that seems almost guaranteed to radically increase the number of frauds operating in US equity markets, the SEC voted this week to remove the requirements that small companies have external auditors review their systems for external controls. [Link; paywall]
Secret Users Of Clearview AI’s Facial Recognition Dragnet Included A Former Trump Staffer, A Troll, And Conservative Think Tanks by Ryan Mac, Carolione Haskins, and Logan McDonald (BuzzFeed News)
As part of our ongoing tally of misdeeds from facial recognition company Clearview, this story reviews the long line of non-law enforcement users who had access to the software. [Link]
Read Bespoke’s most actionable market research by joining Bespoke Premium today! Get started here.
Have a great weekend!
The Closer: End of Week Charts — 3/13/20
Looking for deeper insight on global markets and economics? In tonight’s Closer sent to Bespoke clients, we recap weekly price action in major asset classes, update economic surprise index data for major economies, chart the weekly Commitment of Traders report from the CFTC, and provide our normal nightly update on ETF performance, volume and price movers, and the Bespoke Market Timing Model. We also take a look at the trend in various developed market FX markets.

The Closer is one of our most popular reports, and you can sign up for a free trial below to see it!
See tonight’s Closer by starting a two-week free trial to Bespoke Institutional now!
Last Stocks Above Their Moving Averages
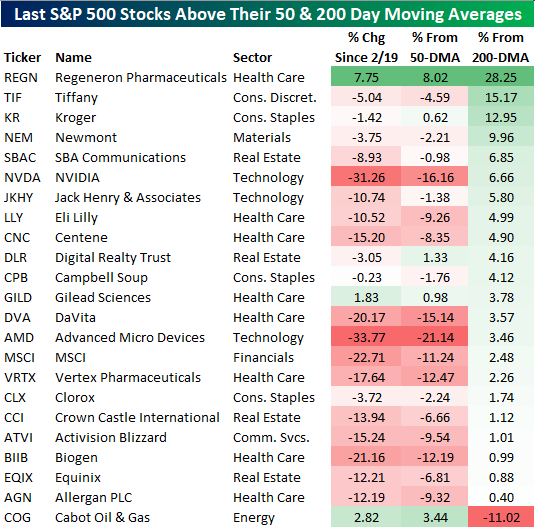
The massive declines over the past few weeks have left conditions extremely oversold. As we highlighted in yesterday’s Sector Snapshot, breadth has been awful while there is no longer a single stock in the S&P 500 that is overbought (1 or more standard deviations above its 50-DMA). In fact, after yesterday’s absolute washout, there is only a small handful of stocks that are above their 50 and 200-DMAs. In regards to the 50-DMA, less than 1% of stocks in the S&P 500 are above this average which is the first time that has happened since 2011. The only time in between that saw a similarly weak reading, although not quite hitting that under 1% requirement was back in December of 2018 when 1.19% of stocks were above their 50-DMA. As for the 200-DMA, only 5.59% are above that level. That is the lowest reading since March of 2009.

The average stock is now 26.56% below its 50-day and 24.5% below its 200-day. The table below shows those 22 remaining stocks that are still above their 200-DMAs as of yesterday’s close and the few that are also below their 50-DMA. Of these, only Regeneron (REGN), Kroger (KR), Digital Realty Trust (DLR), and Gilead Sciences (GILD) are also above their 50-DMAs. The only other stock in the index that is also above its 50-DMA is Cabot Oil and Gas (COG), though it is 11% below its 200-DMA. While these stocks have all held above their long term moving average recently, only GILD and REGN have risen since the index’s high on 2/19. Start a two-week free trial to Bespoke Institutional to access Daily Sector Snapshot and much more.
Bespoke’s Morning Lineup – 3/13/20 – Limit Up (For Now)
See what’s driving market performance around the world in today’s Morning Lineup. Bespoke’s Morning Lineup is the best way to start your trading day. Read it now by starting a two-week free trial to Bespoke Premium. CLICK HERE to learn more and start your free trial.
These days any discussion of levels in the financial markets warrants the qualifier ‘for now’. With that in mind, US equity futures are trading limit up (5%) on optimism that the FOMC will continue to pump liquidity into financial markets, Washington is going to act regarding emergency measures to limit the economic impact, and maybe even that testing will become more widespread. We’re not out of the woods yet, and the headlines are going to get worse, but at some point the market will be able to look through that. Just to give you an idea of how volatile the overnight session was, futures have basically traded in a range of 9%.
Read today’s Bespoke Morning Lineup for a discussion of the carnage in financial markets overnight and the latest tallies on Covid-19 cases.
You’re probably getting sick of charts showing how extreme the moves we have seen in financial markets over the last month have been, but the move in high yield spreads has only been seen at one other time in the last twenty years. In short, when spreads rise it indicates increased risk aversion on the part of investors. In the last four weeks, spreads have increased 386 basis points (bps) or nearly four percentage points. The only time we saw that rapid an increase was at the height of the financial crisis in October 2008.

The Closer – Thursday Thrashing: Fifth-Worst Day for Stocks of All-Time – 3/12/20
Log-in here if you’re a member with access to the Closer.
Looking for deeper insight on markets? In tonight’s Closer sent to Bespoke Institutional clients, after the S&P 500 experienced one of its worst days on record we take a look at some of the other extremes in markets both in the US and abroad. Next, we show some broken aspects of fixed income markets including airline bonds and mortgages. We finish with a look at the declines in Brazil and Canada.

See today’s post-market Closer and everything else Bespoke publishes by starting a 14-day free trial to Bespoke Institutional today!
Sentiment Sours
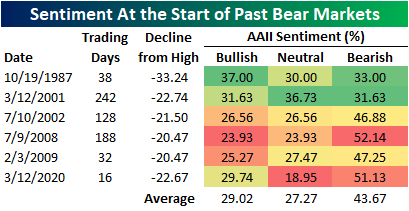
With equities entering bear market territory this week, current sentiment understandably holds a significant bearish bias. Bullish sentiment fell 9 percentage points to 29.74%. While low, sentiment was actually lower as recently as October, August, and the spring of last year.

While that means there is precedent for bullish sentiment to fall even further, the current level is pretty much right in line with what could be expected at the start of an S&P 500 bear market. In the table below, we show the AAII sentiment readings at the start of all bear markets (20% drawdown from a prior high where the rally was at least 20%) since the survey began in 1987 as well as the degree of those declines and the time it took to reach that 20% threshold. The current reading on bullish sentiment is pretty much right in line with the average of past bear markets. Meanwhile, bearish sentiment is at 51.13% which is its highest level for when the S&P 500 reached the threshold for a bear market behind only July of 2008. Neutral sentiment (18.95%) is now at its lowest level since December of 2018 at 18.95% and of the past bear markets, this is the lowest reading.
For just the 56th time since the beginning of the survey in 1987, over half of the respondents reported as pessimistic. Bearish sentiment rose 11.49 percentage points from 39.64% to 51.13%. That 11.49 percentage point jump is in fact large, in the 96th percentile of the past decade’s readings, but as recently as the end of January there was a bigger one week increase of 12.09 percentage points. This leaves bearish sentiment at its highest level since April of 2013 when bearish sentiment reached 54.48%
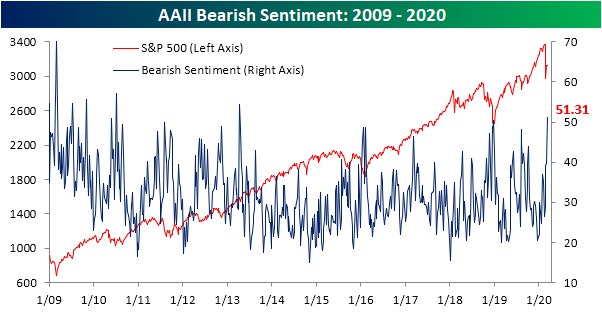
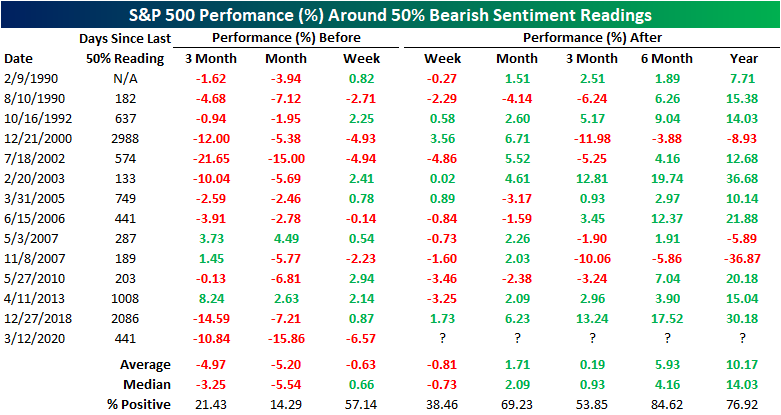
Readings above 50 have been few and far between with only 56 other prior instances in the history of AAII’s survey. The last time we saw a reading this high was was 441 calendar days ago in December of 2018. The table below shows all of the prior times that bearish sentiment tipped above 50% without having done so in the previous 6 months and the S&P 500’s performance around these times. As could be expected, the S&P 500 was typically heading lower in the weeks and months leading up to these elevated bearish readings. Going forward, performance has tended to remain weak over the following week, but begins to improve over the course of the next year. Start a two-week free trial to Bespoke Institutional to access our interactive economic indicators monitor and much more.
Selloff Erases All of US Market Cap Gains Since Election Day 2016
With the US stock market down nearly 7% yet again today, the total market cap of US companies as measured by the Russell 3,000 has fallen $11.5 trillion in less than a month. On February 19th, total US market cap was just over $35 trillion. It’s at $23.8 trillion as of this morning.
What makes this drop even more noteworthy is that $23.8 trillion was the market cap of US companies on Election Day 2016. At this point in time, all of the market cap gains seen since President Trump’s election victory have been wiped out. Visit our membership options page to learn more about Bespoke’s research.
