Back to Average
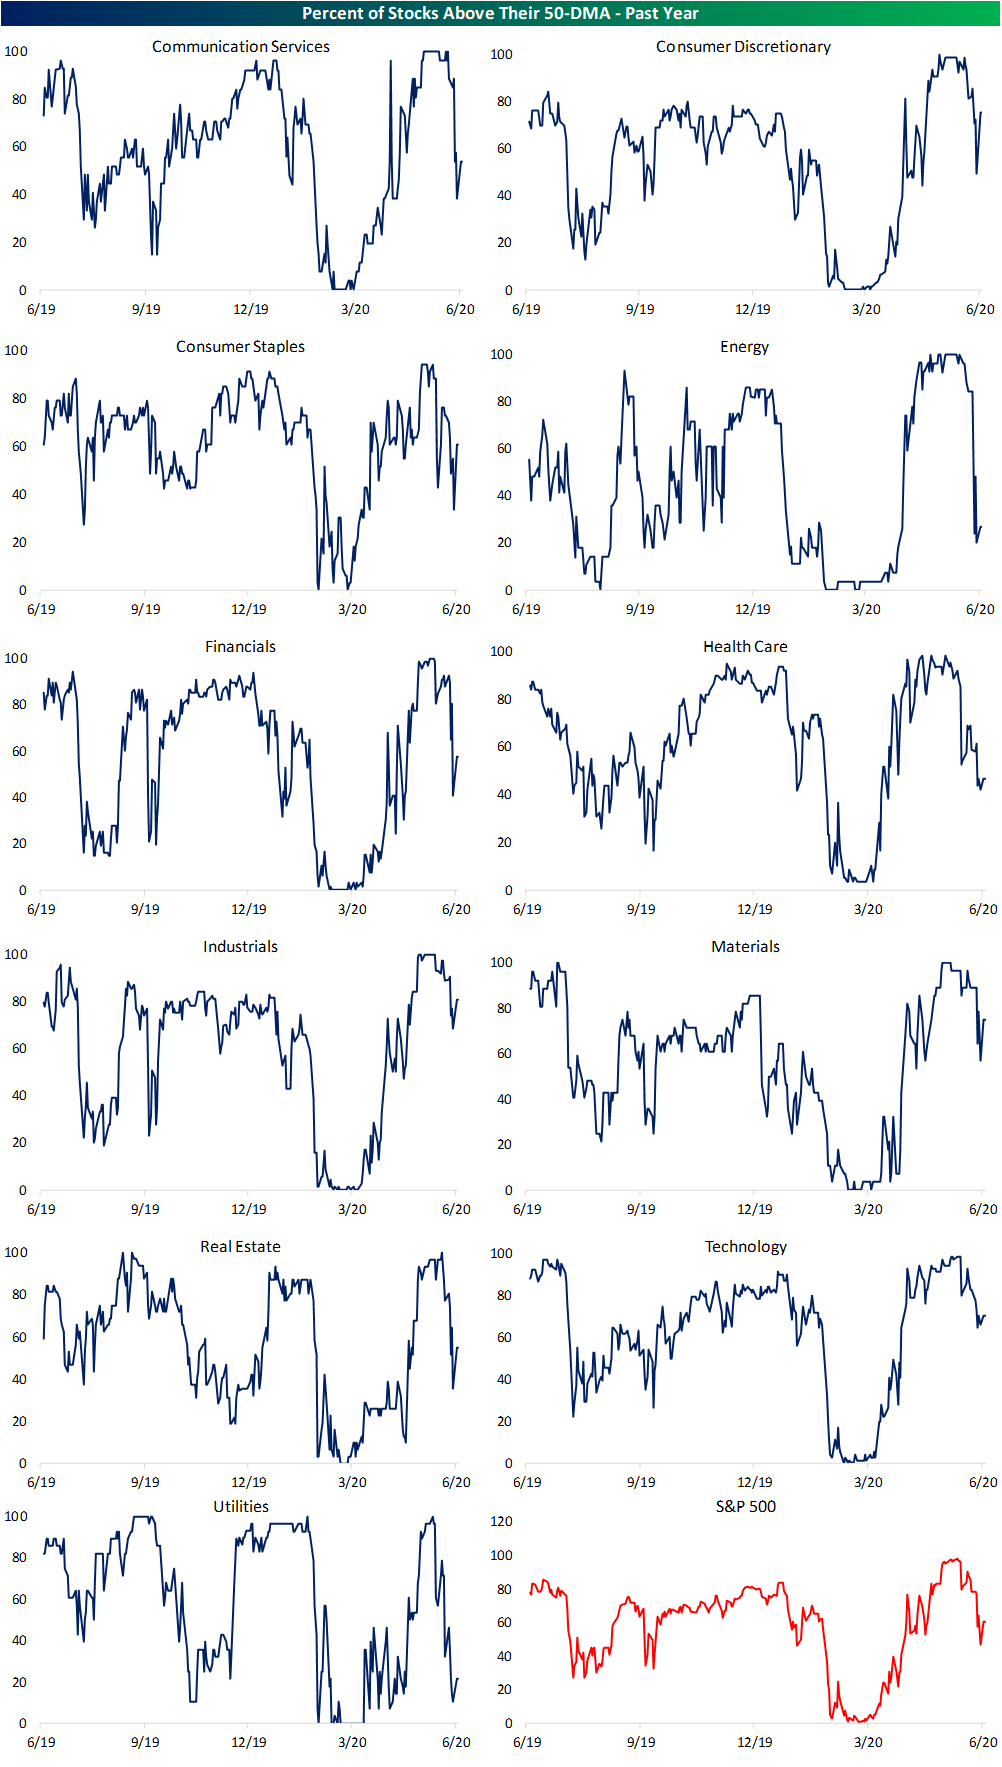
The S&P 500 is down just over 5.5% from its post bear market high set on June 8th. Just about every sector also set a high on that date with the exception of Communication Services (one day later on June 9th) and Technology who’s last high was as the most recent last Tuesday. At the time of those highs, each sector was deep in overbought territory as shown in the charts from our Daily Sector Snapshot below. But with each sector generally falling over the course of June, every sector is closing out the month in a more neutral area of their trading ranges with many hovering within a few percentage points of their 50-DMAs. At the moment, only the Technology sector remains overbought.

Most sectors are now within a few percentage points of their 50-DMAs, and that is a much more moderate reading than some observed in the past few months. As shown in the 50-DMA spread charts from our Daily Sector Snapshot below, the rally off the bear market lows saw some sectors like Energy and Industrials trade more than 20% above their 50-DMAs! For the broader S&P 500, the June 8th high also marked the most extended it got above its 50-DMA at 13.06%. Today that reading is a much more modest 2.33%.

As for the individual stocks within each sector, there has also been significant mean reversion. In the first couple of weeks of June, well over 90% of S&P 500 stocks were above their 50-DMAs. With equities broadly lower since the early month highs, only around 60% of stocks are now above their 50-DMAs. On a sector basis, Industrials have the highest share (80.8%) above while Utilities has the lowest share at only 21.43%. Click here to view Bespoke’s premium membership options for our best research available.
Bespoke’s Morning Lineup – 6/30/20 – It’s So Hard to Say Goodbye to Yesterday
See what’s driving market performance around the world in today’s Morning Lineup. Bespoke’s Morning Lineup is the best way to start your trading day. Read it now by starting a two-week free trial to Bespoke Premium. CLICK HERE to learn more and start your free trial.
We certainly wish we could have more days like yesterday. Although the market didn’t rally enough to erase Friday’s losses, the strong rebound was a moral victory for bulls heading into the final day of the quarter. The rebound also helped to support the idea that last week’s declines were at least in part due to portfolio rebalancing. This morning, futures are mixed with the Dow and S&P 500 indicated modestly lower while the Nasdaq is higher driven by positive earnings reports and guidance from Micron (MU) and Xilinx (XLNX). In terms of data, Chicago PMI and Consumer Confidence will be the key reports to watch.
Be sure to check out today’s Morning Lineup for a rundown of the latest stock-specific news of note, European markets and data, global and national trends related to the COVID-19 outbreak, and much more.

It’s not only going to be hard to say goodbye to yesterday but also the last quarter. With a gain of over 18% heading into the last day, the S&P 500 is on pace for its best quarter since the last quarter of 1998. This quarter’s gain comes after last quarter’s swoon of 20%, so YTD the market is still in the hole by over 5%.

Rebounds Bigger In Texas
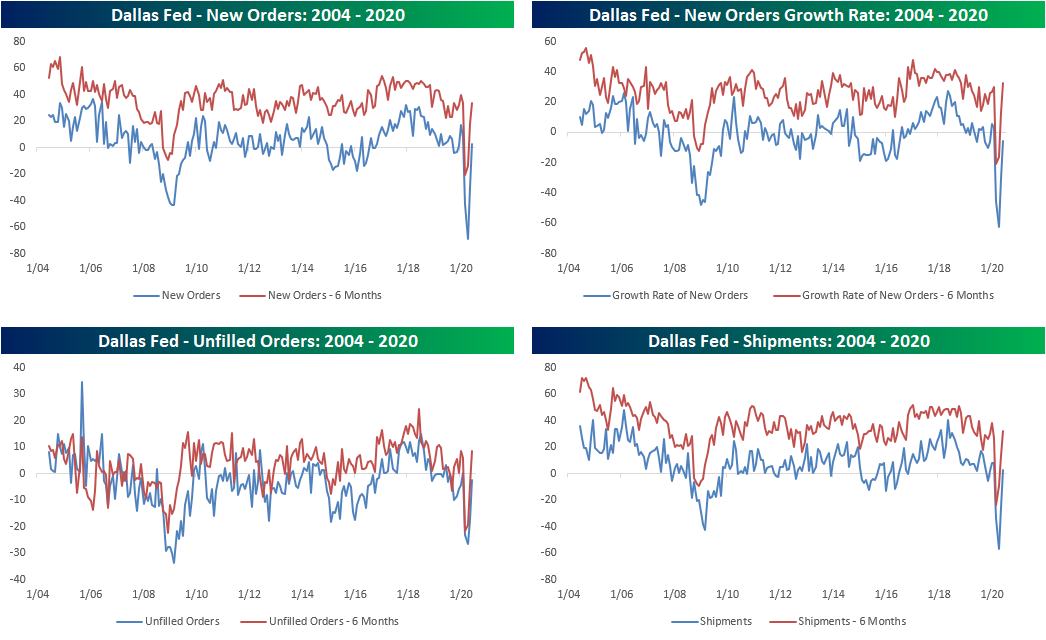
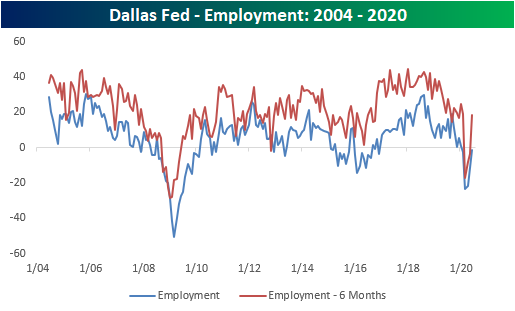
Today’s economic data saw several big beats, including the Dallas Fed’s reading on manufacturing activity. The index fell to a record low of -73.7 back in April, rebounded to -49.2 last month, and was forecast to show yet another very weak reading of -21.4 in June. While it still showed a contractionary reading, the actual level reported in Monday’s report was much better at -6.1. That was the biggest beat relative to expectations since at least 2009. One thing to note regarding this survey is that the collection period ran from June 16th to the 24th which was in the earlier stages of the Texas outbreak.

In addition to the headline number, several components rose by their most on record. That was the case for both outlook and current conditions. Additionally, whereas all but one index showed contractionary readings for current conditions in May, today things have improved with only half showing contractionary readings. Like many other regional Fed indices in June, conditions improved dramatically though they still point to an overall contraction in activity.

Looking across indicators of demand like New Orders and Shipments, there were massive improvements with MoM changes all in the upper 90th percentiles of all periods. As with the headline index, even though there was a massive rebound, the indices also still sit at the lower end of their historical ranges. While New Orders and Shipments are both now showing expansionary readings for the first time in four months, New Orders Growth and Unfilled Orders are still in negative territory. In other words, activity did improve in June but some measures remain more mixed.
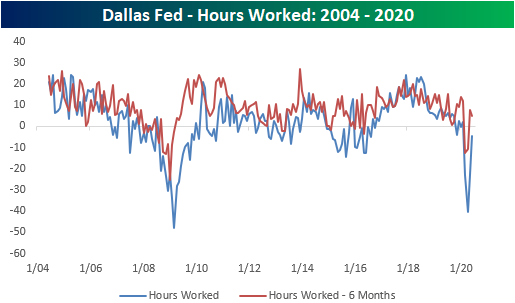
Another area that remains mixed is that of employment. Both indices for Hours Worked and Employment rose in June, but they have continued to show a further shrinking in hours worked and increase in layoffs. Click here to view Bespoke’s premium membership options for our best research available.
US Percent of World Market Cap Dips a Bit
Back at the start of the year, the US equity market made up 39.5% of total global equity market cap. That means the US was and still is by far the largest stock market. In the nearly six months since the start of the year, even with a bear market in between, the US has actually gained share now with 40.31% of the world’s market cap. Even at the bear market low, the US didn’t lose much only falling as low as 39.17%. While the US continues to sit the throne, China is the only other country to have seen their share of global market cap rise in a significant manner since the start of the year having gained 1.65 percentage points; the most of any country YTD. Whereas it began 2020 with 8.44% of world market cap, it now holds over 10%. It is the only country other than the US to boast double digits.
Since the S&P 500’s last all-time high made on February 19th, the US has lost 0.55 percentage points of share, while China has gained 1.35 percentage points over the same time frame. If we look at just since the March 23rd lows for the S&P, the US has gained 1.14 percentage points while China has lost 0.81 percentage points. Other countries that have lost share since the start of the current rally (the lows of the Covid Crash) include Hong Kong, Saudi Arabia, and Switzerland. Countries that have gained share during the rally include Germany, Canada, India, South Korea, and Australia.
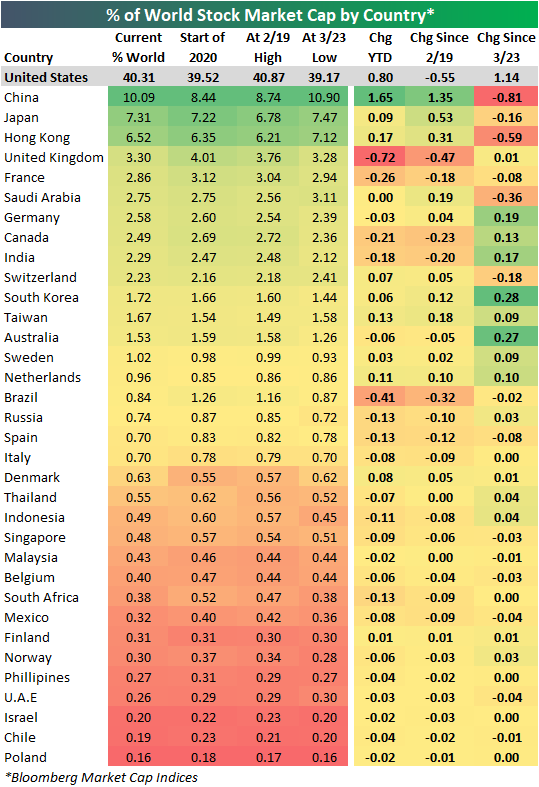
In addition to the US and China, Japan and Hong Kong are the only other two equity markets taking up more than 5% of global market cap at the moment. Below are ten-year charts of each country’s percent of world market cap.

Taking a look at more recent trends, even though the US has gained share since the March 23rd lows, it has begun to lose steam since late May with China picking up at least part of what the US has lost. Hong Kong has similarly seen its share recovering alongside China after a sharp drop in late March and April. Unlike China, Hong Kong has yet to clearly break out from the past few months’ downtrend. Meanwhile, Japan has been fairly stable basically in the middle of the past year’s range. Click here to view Bespoke’s premium membership options for our best research available.

Bespoke Matrix of Economic Indicators – 6/29/20
Our Matrix of Economic Indicators is the perfect summary analysis of the US economy. We combine trends across the dozens and dozens of economic indicators in various categories like manufacturing, employment, housing, the consumer, and inflation to provide a directional overview of the economy.
To access our newest Matrix of Economic Indicators, start a two-week free trial to either Bespoke Premium or Bespoke Institutional now!

Lenin’s Investment Insights
“There are decades where nothing happens and there are weeks where decades happen.” – Vladimir Lenin
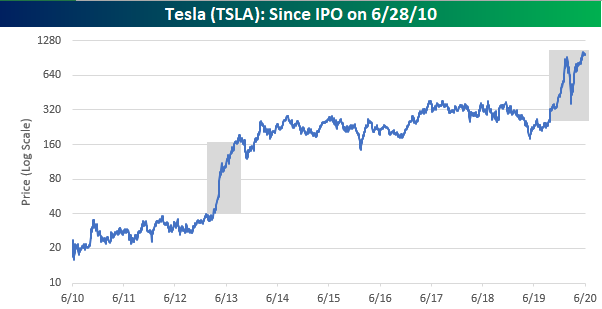
Today marks the 10th anniversary of Tesla’s entry in the public equity market when it opened for trading after pricing its IPO at $17 per share on 6/28/10. By all accounts, Tesla’s IPO was a success. The stock rallied 40% on its first day of trading providing a boost for Elon Musk, who had declared only four months earlier that he was broke. In spite of the company’s strong showing in its IPO, then like now, there was a fair amount of skepticism towards the stock. One analyst questioned whether Tesla would be able to produce more than “a handful of these – if any – in 2012” while others cited looming competition from the Chevy Volt as a threat to the upstart. With the benefit of hindsight, these concerns were obviously unwarranted.
While Tesla’s stock performance has been a home run since the IPO, it hasn’t been a steady climb higher. The chart below shows Tesla’s performance since its IPO on a log scale where each horizontal gridline represents a doubling of the stock. You wouldn’t normally think to take investing advice from Vlad Lenin, but the quote above does a decent job summing up the performance of Tesla’s stock since its IPO. From the time of its IPO in 2010 through early 2013, Tesla’s stock rallied, but it wasn’t until Spring 2013 where the stock really took off, rising from around $40 to $160 in the span of five months. Then from there, the stock practically went into hibernation from late 2013 right up until late 2019 when it once again surged from under $320 to over $1,000. In other words, roughly 90% of Tesla’s gains have been confined to 10% of its trading as a public company (gray boxes). There have been years where Tesla’s stock has been dead money, but there are weeks where decades of gains have been achieved.
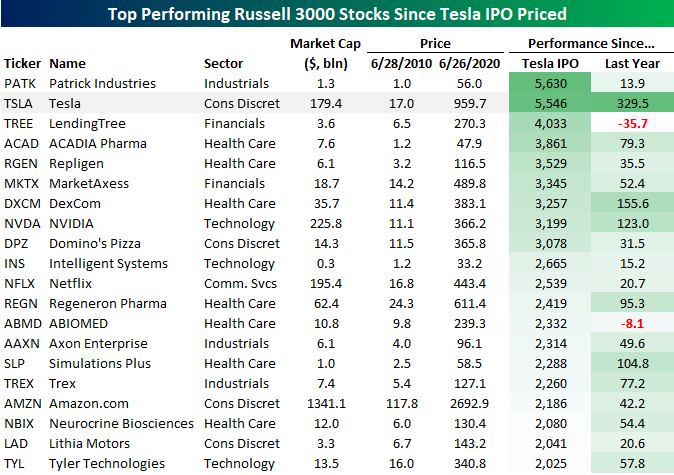
Given it has added two zeros to its share price in the last decade, it should come as no surprise that Tesla has been one of the top-performing stocks in the Russell 3000 since its IPO, but surprisingly it’s not the best. The table below lists the 20 stocks in the Russell 3,000 that have rallied more than 2,000% since Tesla’s IPO priced on 6/28/10. Of these twenty ‘twenty-baggers’, the only one that has outperformed Tesla is Patrick Industries (PATK). While not nearly as sexy as cutting edge electric vehicles, PATK has marginally outperformed Tesla with steady growth in the production and distribution of building products and materials for the RV, manufactured housing, and marine markets. Behind Tesla, Lending Tree has ‘only’ tacked on 4,033% since Tesla’s IPO, but up until recently, it was ahead before falling more than 35% as Tesla tripled in the last year.
Looking at the other big winners in the last ten years, like Tesla (TSLA), there are a number of names like NVIDIA (NVDA), Domino’s (DPZ), Neflix (NFLX), and Amazon.com (AMZN) that all of us have heard of. The majority of names, though, most of us have never heard of. This goes to show that the biggest gains in the stock markets don’t usually come from the names everyone is already talking about, but instead under-the-radar names that operate in the shadows of the ones sucking up all the oxygen. Like Tesla, what a lot of these names have in common is that in most cases the road higher was far from steady. Instead, it was filled with periods of declines or sideways trading where impatient holders of the stocks likely lost conviction and moved on to the newest flavor of the month. Like what you see? Click here to view Bespoke’s premium membership options for our best research available.
Bespoke Brunch Reads: 6/28/20
Welcome to Bespoke Brunch Reads — a linkfest of the favorite things we read over the past week. The links are mostly market related, but there are some other interesting subjects covered as well. We hope you enjoy the food for thought as a supplement to the research we provide you during the week.
While you’re here, join Bespoke Premium for 3 months for just $95 with our 2020 Annual Outlook special offer.
Investing
Free Trades, Jackpot Dreams Lure Small Investors to Options by Gunjan Banerji and Alexander Osipovich (WSJ)
Inexperienced traders are piling into options as well as single-stock trading, fueled by high volatility and cheap commissions. [Link; paywall]
Announcing STOCKHISTORY by Kaycee Anderson (Microsoft)
The development team behind Microsoft Excel has introduced a new feature which allows users to pull stock price data into spreadsheets using native functions. [Link]
COVID
How the Virus Won by Derek Watkins, Josh Holder, James Glanz, Weiyi Cai, Benedict Carey and Jeremy White (NYT)
A breathtaking set of graphics that illustrate the spread of the coronavirus through the United States over the last several months, using viral DNA to track the movement of the virus through space and time. [Link; soft paywall]
Back to School With Covid-19 Rules: Temperature Checks, Few Sports and Lots of Distance by Lucy Craymer and Andrew Jeong (WSJ)
While the US is still amidst summer holidays, other parts of the world have returned to school after COVID-driven closures, and things look nothing like the world that students left behind back in the winter. [Link; paywall]
Economics
Vast Federal Aid Has Capped Rise in Poverty, Studies Find by Jason DeParle (NYT)
The enormous wave of stimulus checks and unemployment insurance payments which have kept the economy afloat since COVID hit have had a side-effect: pulling people out of poverty even as unemployment surges. [Link; soft paywall]
Black Lives Matter Protests, Social Distancing, and COVID-19 by Dhaval M. Dave, Andrew I. Friedson, Kyutaro Matsuzawa, Joseph J. Sabia, and Samuel Safford (NBER)
In a remarkable case of unintended consequences, it appears that Black Lives Matter protests didn’t substantially increase transmission of COVID-19 because protestors only slightly increased transmission while non-protestors stayed home, leading to no net increase in infections. [Link]
Why a small town in Washington is printing its own currency during the pandemic (The Hustle)
In an effort to provide liquidity, a small town has started printing its own currency for use inside its local economy, facilitating transactions without incurring outside liabilities. That approach is one that was used widely during the Great Depression. [Link]
Sports
NFL To Tarp Off Lower Rows Of Seats, Allow Teams To Sell Signage To Local Sponsors by Ben Fischer (Sports Business Daily)
A new NFL ticketing plan would see lower rows sealed off for fans, with advertising visible to TV viewers replacing that part of the stadium. [Link]
Food
What’s Gotten Into the Price of Cheese? by Matt Phillips (NYT)
COVID has massively disrupted supply chains in the dairy industry and the result has been massive volatility in an obscure corner of the futures market that trades cheese. [Link; soft paywall]
Conspicuous Consumption
A New Card Ties Your Credit to Your Social Media Stats by Arielle Pardes (Wired)
Social media influencers who aren’t able to get enough credit are the target market for the Karat Black Card, which will take into account social media account followers when evaluating credit decisions. [Link]
The Secret Economics Of A VIP Party by Ashley Mears (The Economist 1843)
Bottle service and prime tables can lead to six or seven figure tabs, but the real currency of the high end club scene are the young women who frequent it. [Link]
Tech Wreck
For tech-weary Midwest farmers, 40-year-old tractors now a hot commodity by Adam Belz (Minneapolis Star Tribune)
Farmers are opting for used tractors instead of relying on newer models that require a dealer to fix any issue thanks to internet-enabled components. [Link]
Read Bespoke’s most actionable market research by joining Bespoke Premium today! Get started here.
Have a great weekend!
Share Price Performance
The US equity market made its most recent peak on June 8th. From the March 23rd low through June 8th, the average stock in the large-cap Russell 1,000 was up more than 65%! Since June 8th, the average stock in the index is down more than 11%. Below we have broken the index into deciles (10 groups of 100 stocks each) based on simple share price as of June 8th. Decile 1 (marked “Highest” in the chart) contains the 10% of stocks with the highest share prices. Decile 10 (marked “Lowest” in the chart) contains the 10% of stocks with the lowest share prices. As shown, the highest priced decile of stocks are down an average of just 4.8% since June 8th, while the lowest priced decile of stocks are down an average of 21.5%. It’s pretty remarkable how performance gets weaker and weaker the lower the share price gets. Like what you see? Click here to view Bespoke’s premium membership options for our best research available.

Nasdaq – Russell Spread Pulling the Rubber Band Tight
The Nasdaq has been outperforming every other US-based equity index over the last year, and nowhere has the disparity been wider than with small caps. The chart below compares the performance of the Nasdaq and Russell 2000 over the last 12 months. While the performance disparity is wide now, through last summer, the two indices were tracking each other nearly step for step. Then last fall, the Nasdaq started to steadily pull ahead before really separating itself in the bounce off the March lows. Just to illustrate how wide the gap between the two indices has become, over the last six months, the Nasdaq is up 11.9% compared to a decline of 15.8% for the Russell 2000. That’s wide!

In order to put the recent performance disparity between the two indices into perspective, the chart below shows the rolling six-month performance spread between the two indices going back to 1980. With a current spread of 27.7 percentage points, the gap between the two indices hasn’t been this wide since the days of the dot-com boom. Back in February 2000, the spread between the two indices widened out to more than 50 percentage points. Not only was that period extreme, but ten months before that extreme reading, the spread also widened out to more than 51 percentage points. The current spread is wide, but with two separate periods in 1999 and 2000 where the performance gap between the two indices was nearly double the current level, that was a period where the Nasdaq REALLY outperformed small caps.

To illustrate the magnitude of the Nasdaq’s outperformance over the Russell 2000 from late 1998 through early 2000, the chart below shows the performance of the two indices beginning in October 1998. From that point right on through March of 2000 when the Nasdaq peaked, the Nasdaq rallied more than 200% compared to the Russell 2000 which was up a relatively meager 64%. In any other environment, a 64% gain in less than a year and a half would be excellent, but when it was under the shadow of the surging Nasdaq, it seemed like a pittance. Like what you see? Click here to view Bespoke’s premium membership options for our best research available.

Nasdaq 2% Pullbacks From Record Highs
It’s hard to believe that sentiment can change so fast in the market that one day investors and traders are bidding up stocks to record highs, but then the next day sell them so much that it takes the market down over 2%. That’s exactly what happened not only in the last two days but also two weeks ago. While the 5% pullback from a record high back on June 10th took the Nasdaq back below its February high, this time around, the Nasdaq has been able to hold above those February highs.
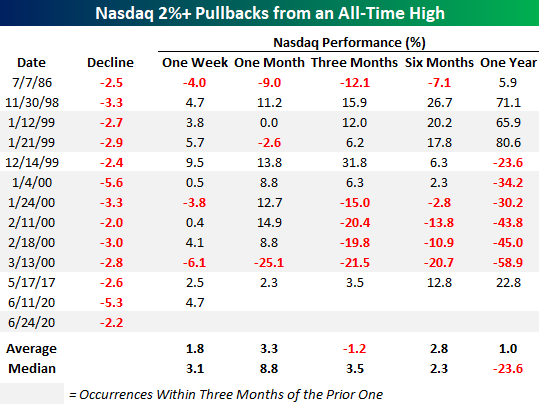
In the entire history of the Nasdaq, there have only been 12 periods prior to this week where the Nasdaq closed at an all-time high on one day but dropped more than 2% the next day. Those occurrences are highlighted in the table below along with the index’s performance over the following week, month, three months, six months, and one year. We have also highlighted each occurrence that followed a prior one by less than three months in gray. What immediately stands out in the table is how much gray shading there is. In other words, these types of events tend to happen in bunches, and if you count the original occurrence in each of the bunches, the only two occurrences that didn’t come within three months of another occurrence (either before or after) were July 1986 and May 2017.
In terms of market performance following prior occurrences, the Nasdaq’s average and median returns were generally below average, but there is a pretty big caveat. While the average one-year performance was a gain of 1.0% and a decline of 23.6% on a median basis, the six occurrences that came between December 1999 and March 2000 all essentially cover the same period (which was very bad) and skew the results. Likewise, the three occurrences in the two-month stretch from late November 1998 through January 1999 where the Nasdaq saw strong gains also involves a degree of double-counting. As a result of these performances at either end of the extreme, it’s hard to draw any trends from the prior occurrences except to say that they are typically followed by big moves in either direction. The only time the Nasdaq wasn’t either 20% higher or lower one year later was in 1986. Like What you see? Click here to view Bespoke’s premium membership options for our best research available.