“Meet the Nasdaq”
Tim Russert used to sign off from each week’s episode of Meet the Press with the tagline, “If it’s Sunday, it’s Meet the Press.” Borrowing from that phrase, the Nasdaq’s tagline might as well be “If it’s Monday, it’s Meet the Nasdaq.” With a gain of over 3% today, the Nasdaq is doing what it always does on Mondays – rally! The chart below shows the year-to-date performance of the Nasdaq so far in 2020 as well as its performance if you only owned the index on Mondays. Year to date, the Nasdaq is up an impressive 32.7%, putting it on pace for the first back-to-back annual gain of over 30% since 1998 and 1999. Even crazier, though, is the fact that the Nasdaq is up over 20% year-to-date on Mondays alone! The weekday that most people love to hate has been responsible for more than 60% of this year’s Nasdaq gain.
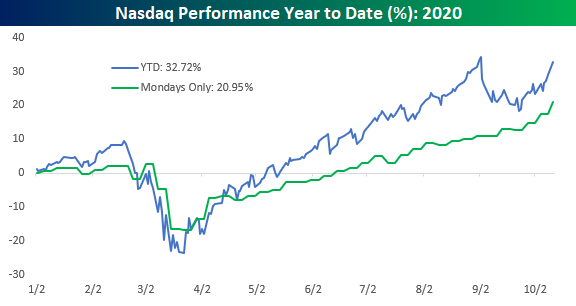
In the table below we summarize the performance of the Nasdaq by weekday so far in 2020. Monday’s average daily gain of 0.57% with gains more than 75% of the time is both the best average daily return and the most consistent to the upside. Tuesdays and Wednesdays haven’t been particularly bad for the Nasdaq either. Both days have seen an average one-day gain of 0.30% or more, and Wednesday has been positive three-quarters of the time. While the first three trading days of the week have been strong, Thursday and Friday have been days to forget. Although both days have also experienced positive returns more than half of the time, the average one-day change for both is negative resulting in declines on a cumulative. Thursday has been the weakest with a cumulative decline of 11.53% while Friday’s cumulative decline has been more modest at just 3.46%. TGIM. Click here to view Bespoke’s premium membership options for our best research available.

Economic Data and Earnings In Earnest
Although a very busy news week made up for it, last week was uneventful on both the earnings and economic data front. In terms of earnings, only eight companies reported, and for economic data, as shown below, there weren’t even a dozen releases.

This week is another story. On the economic data front, there are more than two dozen releases crammed into Tuesday through Friday (there are no scheduled releases for today due to the Columbus Day holiday). Small business optimism will be the first release of the week early Tuesday morning. CPI will be out later in the day with PPI following up on Wednesday morning. Tuesday will also see manufacturing readings from the Philly and New York Fed, and we’ll get the usual Thursday weekly releases like jobless claims and Bloomberg Consumer Comfort. Friday closes out the week with retail sales, industrial production, University of Michigan sentiment, and TIC flows all on the docket.

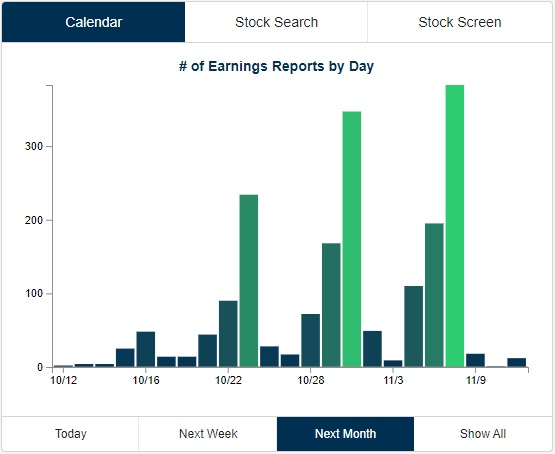
Not only is economic data ramping up but so too are earnings. Whereas last week only saw 8 earnings reports, this week there are over ten times that number as earnings season kicks off with some of the big banks like Citi (C) and JPMorgan Chase (JPM) reporting. As shown in the snapshot from our Earnings Explorer below, the following three weeks will only see the number of companies reporting accelerate with peak earnings season in the first week of November. Click here to view Bespoke’s premium membership options for our best research available.
Air Passenger Traffic Achieves Upward Lift
With COVID case counts on the rise throughout the country, you would think that Americans would be a bit more concerned about getting on airplanes. Rather than hunker down, though, Americans have been increasingly spreading their wings. The latest passenger throughout numbers released by TSA showed that on Sunday 984,234 passengers went through security checkpoints at US airports. That was the highest single-day reading since March 16th. This weekend’s air passenger traffic also helped to push the 7-day average of traffic to new post-COVID highs. After rising and then falling back down after the Labor Day holiday, air passenger traffic has ‘surged’ in recent days to push the current 7-day average up to 819,384 passengers per day.
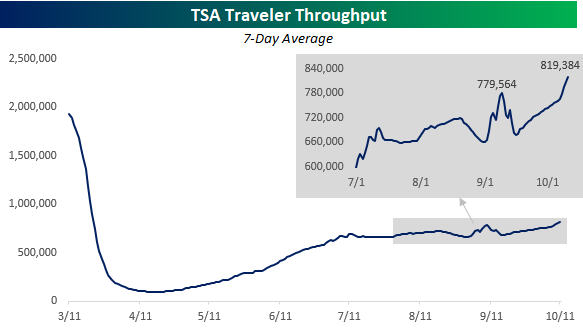
Air travel has been on the rise, but the term surge may be too strong. When we compare air passenger traffic levels to where they were a year ago, we’re still down over 65% on a 7-day average basis. Even yesterday’s strong passenger numbers were still down over 61% from their same levels last year. In other words, there’s still a lot of room for improvement! The chart below compares the y/y change in passenger throughput to the performance of the Airline ETF (JETS) since the start of the pandemic. Not surprisingly, there has been a pretty strong correlation between the two as increases in passenger traffic have been accompanied by rallies in the airlines and vice versa. Click here to view Bespoke’s premium membership options for our best research available.

Bespoke’s Morning Lineup – 10/12/20 – “Soft” Open
See what’s driving market performance around the world in today’s Morning Lineup. Bespoke’s Morning Lineup is the best way to start your trading day. Read it now by starting a two-week free trial to Bespoke Premium. CLICK HERE to learn more and start your free trial.
“Do more of what works and less of what doesn’t.” – Steve Clark
Due to the Columbus Day holiday, it’s a quiet start to the week in terms of data related to earnings and the economy, but equities are poised for a very strong start anyways as tech stocks lead the rest of the market higher. More specifically, it’s the software sector that’s driving the rally this morning, and one catalyst for the gains is the $3.2 billion takeover of Segment by software darling Twilio (TWLO). While stocks of the acquiring company usually take a hit when a merger is announced, this morning TWLO is trading more than 5% higher to record highs, and that comes after already tripling this year!
Be sure to check out today’s Morning Lineup for a rundown of the latest stock-specific news of note, market performance in the US and Europe, manufacturing in Japan, trends related to the COVID-19 outbreak, and much more.

On the topic of software, just last week the group looked to be starting to break out of a consolidation phase after underperforming the broader market since early September. Today’s rally should further the move out of congestion, but the group still enters the week trading down close to 5% from its prior high.
 Bespoke
Bespoke Brunch Reads: 10/11/20
Welcome to Bespoke Brunch Reads — a linkfest of the favorite things we read over the past week. The links are mostly market related, but there are some other interesting subjects covered as well. We hope you enjoy the food for thought as a supplement to the research we provide you during the week.
While you’re here, join Bespoke Premium with a 30-day free trial!
Treatments
Eli Lilly says its monoclonal antibody cocktail is effective in treating Covid-19 by Matthew Herper (Stat News)
Internal numbers from Eli Lilly this week showed that its monoclonal antibody treatment reduced viral load over the 11 days after treatment, with 0.9% of recipients visiting the ER versus 5.8% for the placebo. This is extremely welcome news, and especially when combined with our next link’s news. [Link]
Remdesivir for the Treatment of Covid-19 — Final Report by John H. Beigel, Kay M. Tomashek, Lori E. Dodd, Ph.D., Aneesh K. Mehta, Barry S. Zingman, Andre C. Kalil, Elizabeth Hohmann, Helen Y. Chu, Annie Luetkemeyer, Susan Kline, Diego Lopez de Castilla, Robert W. Finberg, et al.
The second piece of good treatment news this week was this New England Journal of Medicine study which showed impressive positive effects from remdesivir. Recipients had a median recovery time of 10 days versus 15 days for placebo, with mortality of 6.7% versus 11.9% for placebo after 15 days. [Link]
Investing
Vatican used charity funds to bet on Hertz credit derivatives by Miles Johnson and Robert Smith (FT)
While the story is sensationalized (including the frankly hilarious observation that the Pope isn’t believed to have known anything about the investment) the details report a relatively generic credit exposure which paid out in full. [Link; paywall]
Fidelity Reviewed Which Investors Did Best And What They Found Was Hilarious by Myles Udland (Business Insider)
A throwback to 2014, but a good one: Fidelity data showed that customers which performed best were those who had forgotten that they had an account with the broker. [Link]
Quis custodiet ipsos cynicis?
AIER Hosts Top Epidemiologists, Authors of the Great Barrington Declaration by AIER
An argument that the most deaths of any year in American history should have unleashed more fatalities in order to satisfy arcane cost-benefit calculations. [Link]
Schools Aren’t Super-Spreaders by Emily Oster (The Atlantic)
Similarly to the Great Barrington Declaration, this analysis relies on an economist to argue that strategies designed to manage the epidemic which may create inconvenience are actually ineffective. [Link]
Using Google Trends to Predict U.S. Elections (Superhighway 98)
This analysis argues raw Google search counts are a perfect predictor of Presidential election outcomes; notably, it does not account for the fact that those searches are relatively ineffective at predicting popular vote outcomes. [Link]
Fiscal Policy
Fed Tenure Boosts Lael Brainard as Potential Biden Treasury Pick by Nick Timiraos (WSJ)
If Google search results are wrong and the President isn’t re-elected, a likely pick for Treasury will be Governor Brainard, who has been working diligently at the Federal Reserve on a range of priorities that might endear her to Democrats. [Link; paywall]
Travel
Half a Billion Trips Show China’s Economy Moving Past Covid (Bloomberg)
With almost zero COVID presence in the country of its origin, the Golden Week holiday unleashed almost half a billion domestic travelers to move around China. [Link; soft paywall, auto-playing video]
Aviation Outsider Builds Supersonic Jet for Transatlantic Flight by Ashlee Vance (Bloomberg)
A small aviation enthusiast has managed to build a supersonic jet prototype that has a realistic shot at becoming a commercial option for overseas flights around the world. [Link; soft paywall, auto-playing video]
Cruise ship dismantling booms in Turkey after pandemic scuttles sector by Bulent Usta (Reuters)
Ship-breakers in Turkey are stripping large numbers of cruise vessels into scrap and components that are sold on for recycled purposes in a range of industries. [Link]
Remote Work
Microsoft is letting more employees work from home permanently by Tom Warren (The Verge)
Even after it re-opens US offices, Microsoft employees will be permitted to work from home at least half the time, and managers will be able to approve full remote work. [Link]
Economic Research
A B.C. research project gave homeless people $7,500 each — the results were ‘beautifully surprising’ by Bridgette Watson (CBC)
A study in Vancouver tried giving houseless people cash with no strings. Recipients reduced spending on drugs, alcohol and cigarettes by 39%, managed to save an average of $1,000 12 months later, spend fewer days homeless, and moved into stable housing two months faster than the control group. [Link]
Old Stories
“Bruges fishermen can continue fishing in British waters after Brexit thanks to 1666 Charter” by Michaël Torfs (VRT)
A charter granted by English King Charles II dating back to 1666 is being used as precedent as the EU and UK square off over fishing rights. [Link]
How Mosquitoes Changed Everything by Brooke Jarvis (The NYer)
The long and deadly history of a pest that is typically an annoyance for modern Americans but historically felled empires and killed millions. [Link; soft paywall]
K-Shaped Recoveries
High-end retailers, posh eateries rebounding after COVID setback by Steve Cuozzo (NYP)
Despite the author’s efforts to paint the grimmest possible picture of pandemic New York, high-end retailers that don’t rely on middle class consumers are showing green shoots….for those who can afford it. [Link]
Terrorism
Plans to kidnap Whitmer, overthrow government spoiled, officials say by Robert Snell and Melissa Nann Burke (The Detroit News)
A heavily armed gang surveilled and planned to kidnap Michigan Governor Gretchen Whitmer this summer, according to communications included in a federal indictment this week. [Link]
Proprietary Data
A Corporate Sleuth Claims Squarepoint Capital Took Her Content. The Hedge Fund Is Threatening Action. What Actually Happened? by Richard Teitelbaum (Institutional Investor)
Widely-used financial research service Footnoted stopped operating, and the owner claims it was in large part out of concern that her data and algorithms had been stolen by a hedge fund masquerading as a customer. [Link]
Read Bespoke’s most actionable market research by joining Bespoke Premium today! Get started here.
Have a great weekend!
Ten-Baggers Under Trump
In our prior post we looked at the best and worst performing S&P 500 stocks since Election Day 2016. In this post we’ve broadened our filter and looked at the Russell 3,000, which is an index that covers more than 98% of all publicly traded market cap in the US. Within the Russell 3,000, there are 32 stocks that are up more than 1,000% since Trump was elected. These 32 “ten-baggers” — as Peter Lynch liked to call them — are listed in the table below.
At the top of the list is Enphase Energy (ENPH), which is up 8,892% since Election Day 2016. While Enphase has “Energy” in its company name, it’s actually a Technology sector stock that “manufactures software-driven home energy solutions that span solar generation, home energy storage and web-based monitoring and control.” Next up is Zynex (ZYXI) with a gain of 7,211%, followed by Digital Turbine (APPS) up 5,320%. ZYXI markets itself as a “better and safer way to manage pain” than opiods using electrotherapy devices. APPS is an app marketing company that helps app developers get their product on as many devices as possible.
Of the 16 best performing Russell 3,000 stocks since Election Day 2016, 15 come from either the Technology or Health Care sectors. XPEL is the only stock in the top ten that’s not in either the Tech or Health Care sectors. Up 2,341% since Trump was elected, XPEL is a Consumer Discretionary stock whose main product is to provide auto-paint protection.
Along with the names mentioned already, other notables on the list of ten-baggers under Trump include Jack Dorsey’s Square (SQ), pet-food maker Freshpet (FRPT), digital health company Teladoc (TDOC), the arts and crafts social media company Etsy (ETSY), and of course, Tesla (TSLA). With a gain of 1,002% since November 8th, 2016, Tesla just barely makes the cut! Click here to view Bespoke’s premium membership options for our best research available.

Best Performing Stocks Since Election Day 2016
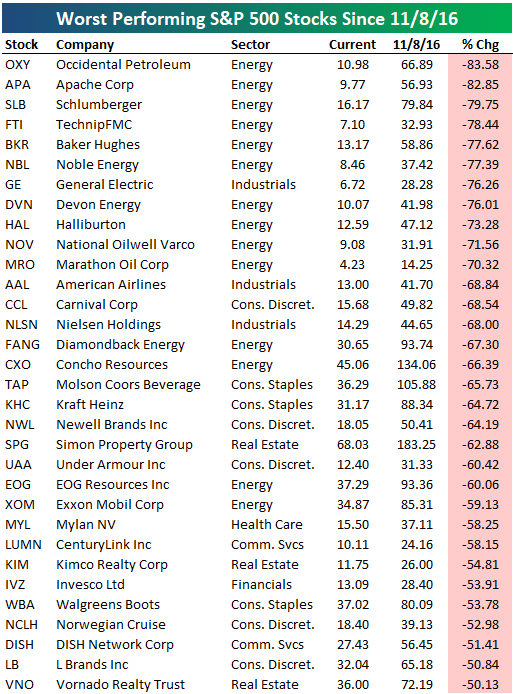
On Monday we published our asset class performance matrix showing total returns for key ETFs since Election Day 2016 (11/8/16). Today we wanted to highlight the individual stocks traded on US exchanges that have performed the best and the worst since President Trump surprised the world with a victory over Democratic candidate Hillary Clinton. First off, below is a chart showing the average performance of stocks in each S&P 500 sector since Election Day 2016. (These are based on stocks currently in the index and not as the index stood on 11/8/16.)
As shown, the average stock in the broad S&P 500 is up 67.3% since Trump was elected. Four sectors have posted stronger average returns than that — Technology (+160.4%), Health Care (+100.3%), Consumer Discretionary (+74.6%), and Industrials (+69.9%).
The Energy sector stands out like a sore thumb in the chart below. While every other sector has at least averaged double-digit percentage gains, the stocks in the Energy sector are down an average of 52.3% since Trump was elected! Other sectors that have been weaker than the broad market include Real Estate, Consumer Staples, and Financials.
If you were to ask most people back in November 2016 which areas of the market should outperform under Trump and which should underperform, you’d likely see results that are the exact opposite of what has actually happened. Sectors like Energy, Real Estate, and Financials would have been expected to benefit from Trump since those are the industries he’s most associated with, while Tech is a sector that’s usually expected to benefit more when the Democratic party is in control.

Looking at individual stocks, below we show the 46 stocks currently in the S&P 500 that are up at least 200% since Election Day 2016. Two stocks — Etsy (ETSY) and Advanced Micro (AMD) — have been “10-baggers” with gains of more than 1,000%, while another three — Paycom (PAYC), NVIDIA (NVDA) and DexCom (DXCM) — are up more than 500%. Other names on the list are a who’s who of the most popular stocks over the past few years, including Adobe (ADBE), Netflix (NFLX), Apple (AAPL), Amazon.com (AMZN), Microsoft (MSFT), salesforce.com (CRM), and PayPal (PYPL).

While there are 46 stocks in the S&P 500 up more than 200% since Election Day 2016, there are 32 stocks that are down more than 50% over the same time frame. The Energy sector is the most represented on this list by far with 14 stocks overall and 10 of the worst 11! The only non-Energy stock in the top ten is General Electric (GE), which is down 76% since Trump was elected. Other notable losers include airlines and cruiselines like AAL, CCL, and NCLH, and consumer stocks like TAP, KHC, UAA, WBA, and LB.
General Electric (GE) and Exxon Mobil (XOM) are the two names that stand out the most. Each of these stocks were at one point in time the largest company in the world, but they’re both now shells of their former selves with huge losses over the last four years. Remember these two examples when you’re looking at the largest companies in the world right now. Chances are a few of them will experience similar fates as GE and XOM over the next ten to twenty years. Click here to view Bespoke’s premium membership options for our best research available.
News High for Net New Highs
Yesterday, the S&P 500 closed at its highest level since only a few days after the early September high. While the index has yet to reach a new high, many individual stocks in the index have. As shown in the charts below, 11.71% of S&P 500 stocks closed at a new 52-week high yesterday while no stocks closed at a new 52-week low. That makes for the second-highest net new highs reading of the pandemic with the only higher reading (17.62%) occurring just over a month ago at the last all-time high on September 2nd. Before that, the last time net new highs were as high as now was on February 19th: the last all-time high before the bear market began.
As for the individual sectors, there has also been a significant pickup in the net percentage of new 52-week highs. Industrials currently has the highest reading of net new highs among the 11 sectors at 26%. Just like the broader S&P 500, that is the highest since September 2nd when the net percentage of new highs rose above 30%. Consumer Discretionary is the runner up in being the sector with the highest percentage of net new highs. One distinguishing factor, though, is whereas every other sector has seen higher readings at some point since the bear market in the spring, Consumer Discretionary’s current reading of 18% is tied with the reading from August 24th. On the other end of the spectrum, both Communication Services and the Energy sector have seen no new highs over the past few days. Granted, there have not been any new 52-week lows either. Meanwhile, Financials and Real Estate have both seen an uptick in net new highs, but it has been much more modest than other sectors. Click here to view Bespoke’s premium membership options for our best research available.

Bespoke’s Morning Lineup – 10/9/20 – Finishing Strong
See what’s driving market performance around the world in today’s Morning Lineup. Bespoke’s Morning Lineup is the best way to start your trading day. Read it now by starting a two-week free trial to Bespoke Premium. CLICK HERE to learn more and start your free trial.
“When you learn to let go of the need to be right, being wrong gradually loses its power to disturb you.” – Yvan Byeajee
In the ongoing saga over the china trade deal stimulus talks, it appears as though things are back on again, or at least what the pundits are saying. Futures are higher this morning, and while it could be due to optimism over a larger stimulus bill getting done, it could also very well be over less uncertainty regarding the election, economic improvement even without a stimulus, or the fact that more successful treatments for COVID-19, even without a vaccine seem to come out every day. Just today, Gilead’s CEO was on CNBC and commented that a study of Remdesivir shortened recovery times of COVID patients by five days and significantly reduced the number of people that died of the virus.
Be sure to check out today’s Morning Lineup for a rundown of the latest stock-specific news of note, market performance in the US and Europe, European manufacturing, trends related to the COVID-19 outbreak, and much more.
We’re all familiar with the saying “Show me a man’s [or woman’s] friends, and I’ll show you the man [woman].” A corollary to that could be, “Show me which way the dollar is moving, and I’ll show you the direction of the stock market.” You see, so far this year, the direction of the dollar every month has been the opposite of the S&P 500. So when the dollar has rallied, as it did in the first three months of the year and in September, the S&P 500 declined. Likewise, in months where the Dollar Index declined, the S&P 500 rallied. October is only eight days old, but so far the Dollar Index has dropped 0.60% and the S&P 500 is up 2.49%. See, it’s as easy as that!

Breadth Booming
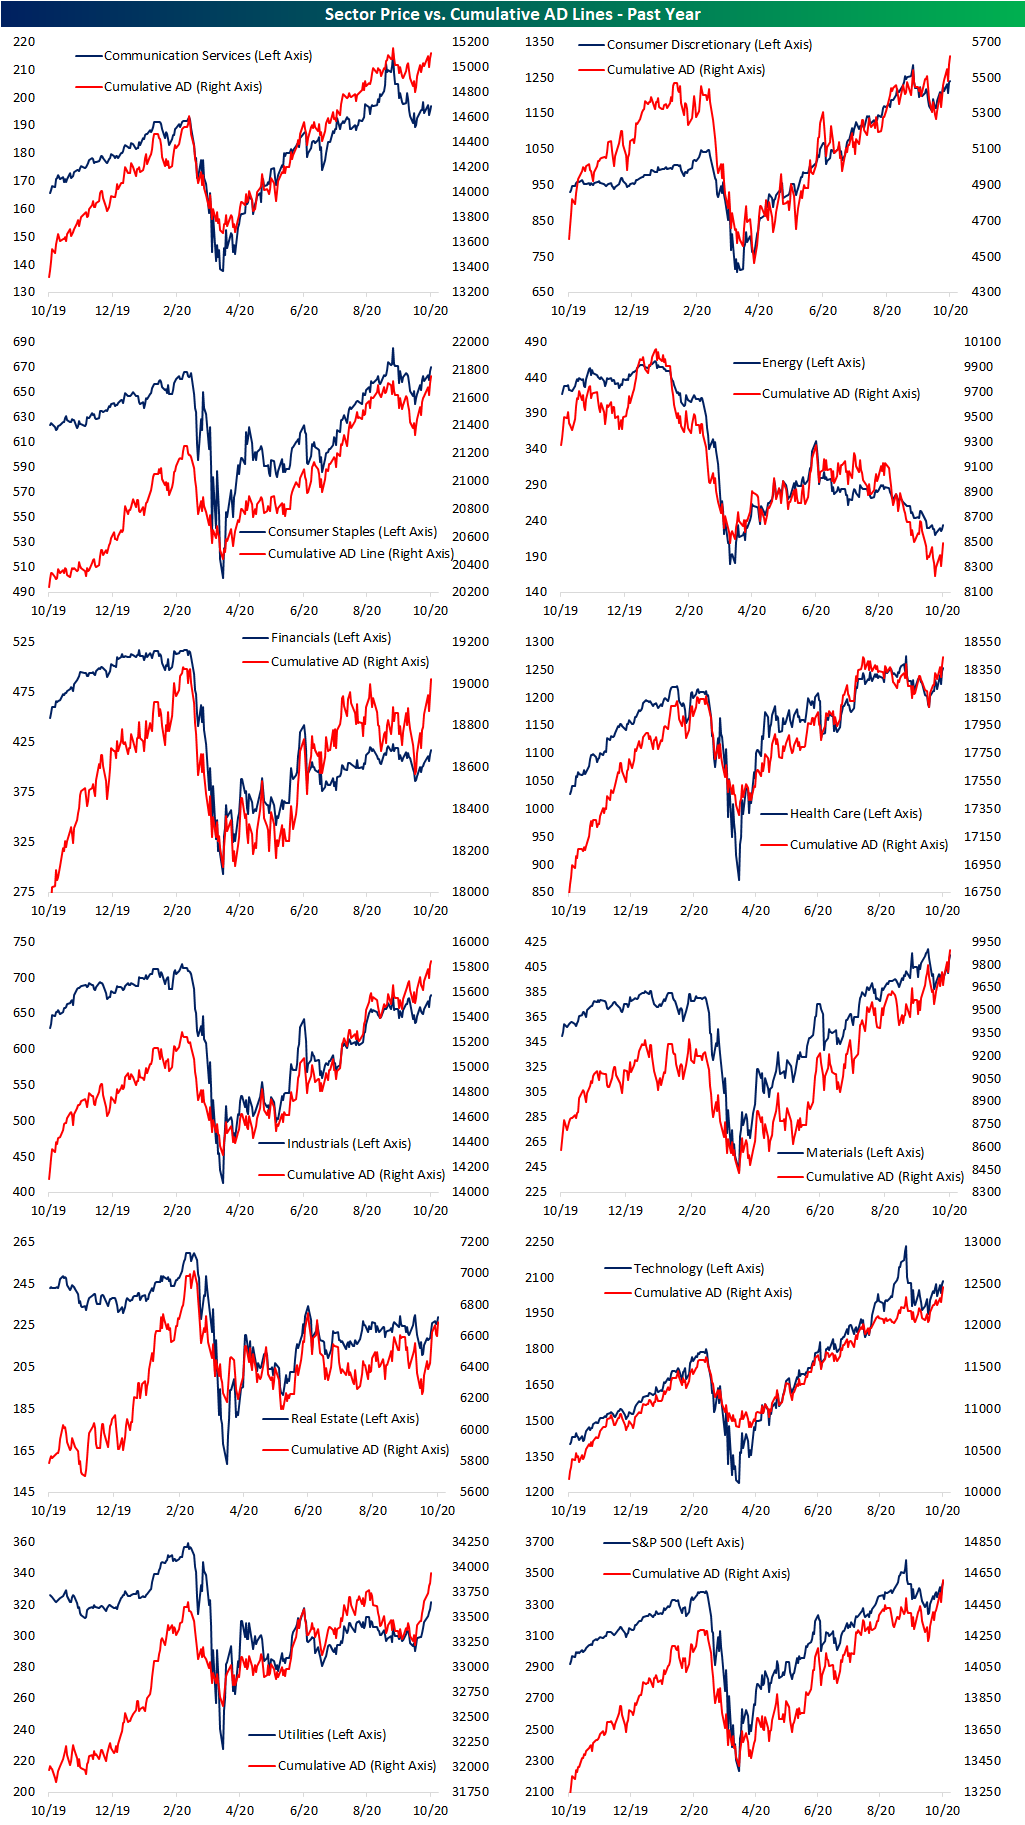
One of the most notable aspects of the rally off the late September lows has been broad participation. As shown below, breadth is very strong as the 10-day advance-decline lines for several sectors are at some of their highest levels of the past year. For the S&P 500, the 10-day advance-decline line is at its highest level since June 8th. The same can be said for Communication Services, Consumer Discretionary, Financials, and Real Estate. For Consumer Staples, the sector’s 10-day A/D line is at its highest level since June of 2019 and for Health Care it is at its highest level since May of 2019. In the case of Technology, it has been even longer as that sector’s line is at its highest level since last April.
While broad participation is healthy for the long-term prospects of a rally, these 10-Day A/D lines have gotten extremely overbought in the near term, suggesting a cool-down period is likely in the days ahead.
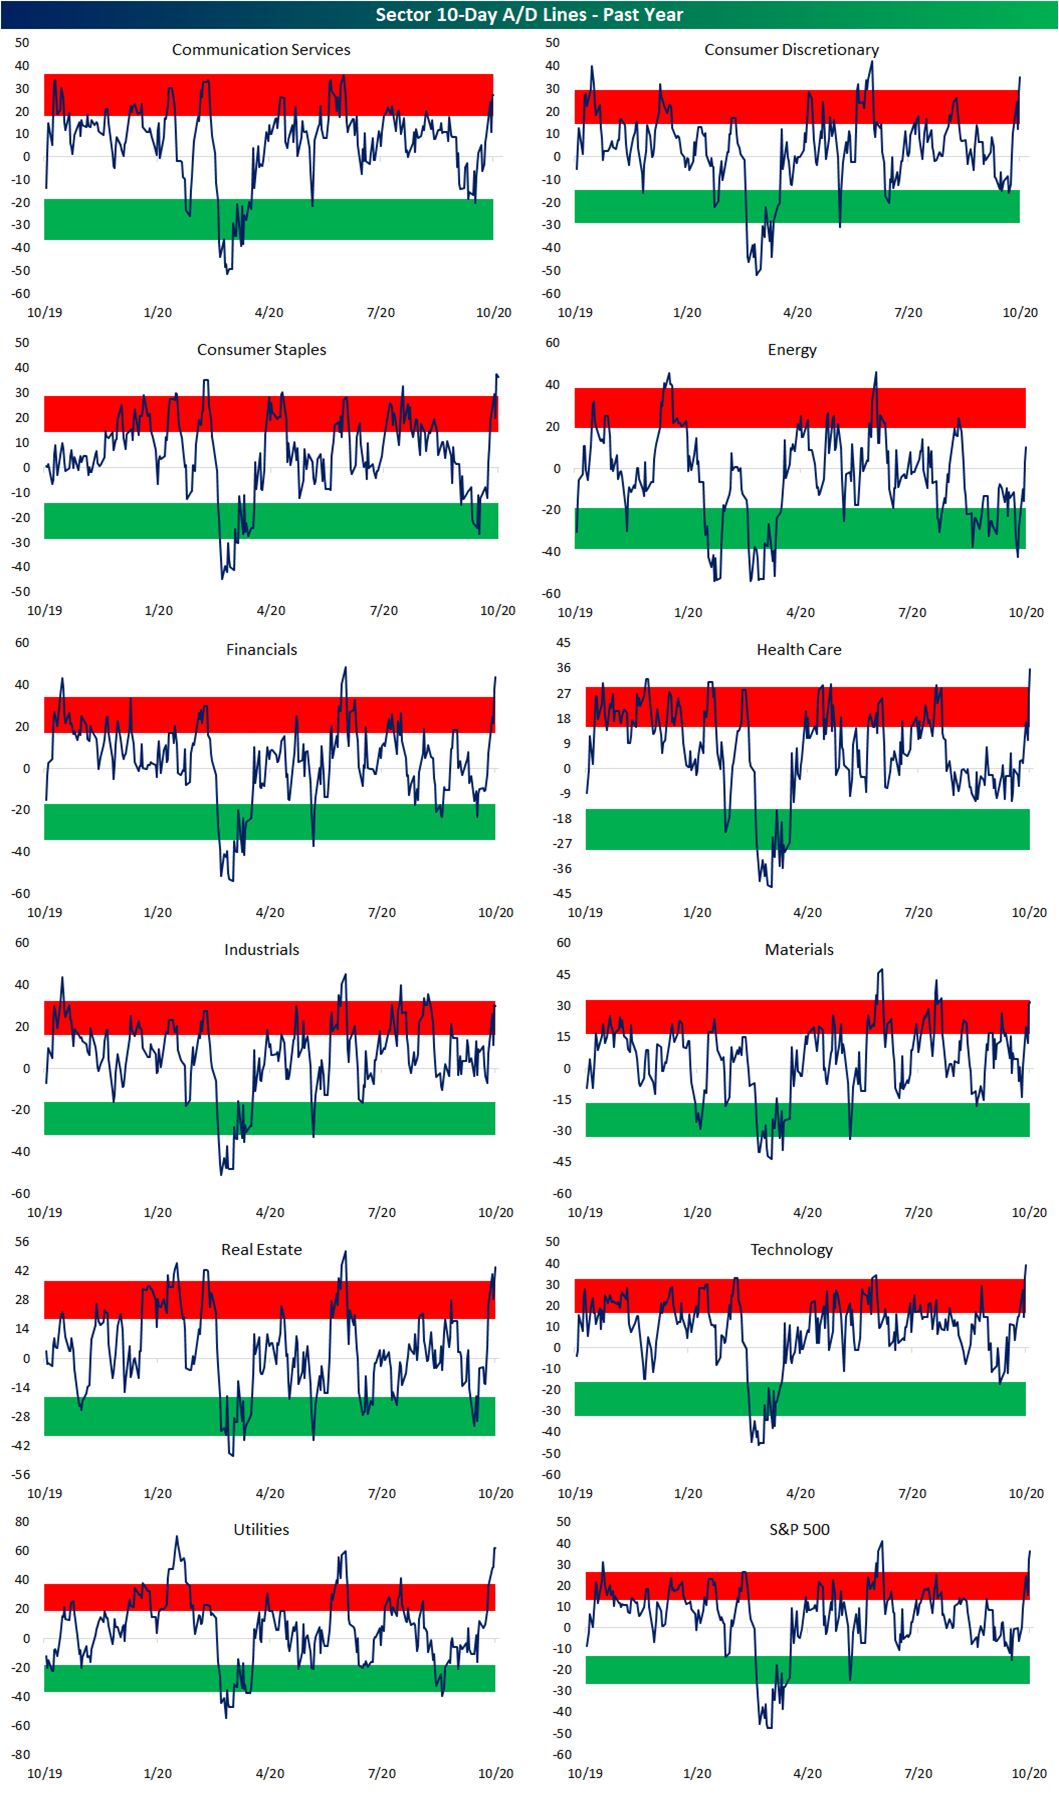
With short term breadth running very hot, the cumulative A/D lines of several sectors are breaking out to new highs as well. Utilities and Materials are the only sectors to have seen prices reach a new high in the past few days alongside their cumulative A/D lines. As for the other sectors, Consumer Discretionary, Consumer Staples, Health Care, Materials, and Tech have also all seen new highs for cumulative breadth. The same applies to the S&P 500, but again, none of these have yet to see price do the same. You can see these sector charts along with many more in our Daily Sector Snapshot. The Sector Snapshot is included with a Bespoke Premium membership. Click here to start a two-week free trial to Bespoke Premium.